Fig. 2.
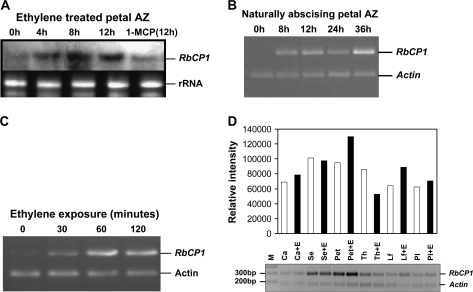
(A) Transcript accumulation of RbCP1 during the course of petal abscission in rose as determined on a northern blot. RNA from petal abscission zones of ethylene-treated (0–12 h) and 1-MCP treated (12 h) flowers was used for the study. The lower panel shows ribosomal RNA as a loading control. AZ, abscission zone. (B) Semi-quantitative RT-PCR of RNA from petal abscission zones of field-abscising flowers at different time periods (0–36 h). Reverse transcribed RNA from different samples was PCR amplified to give an amplified fragment of 300 nt using RbCP1 specific primers CyproOF and CyproR4P1. Rose actin primers that amplified a fragment of 180 bp were included in the reaction mix as an internal control for normalization. (C) Semi-quantitative RT-PCR to show early ethylene responsive accumulation (30, 60, and 120 min post-ethylene treatment) of RbCP1 transcripts during petal abscission in rose using the same primers as described (B). Actin was used as an internal control in the same reactions for normalization. (D) Comparison of expression of RbCP1 in various tissues before and after 8 h ethylene treatment by semi-quantitative RT-PCR (negative image). Reverse transcribed RNA from different tissues was PCR amplified using the same primers as described in (B) with actin as an internal control. The intensity of the actin band for each tissue set (with and without ethylene) was normalized and the relative intensity of the cysteine protease band calculated accordingly. White bars, ethylene untreated samples; black bars, 8 h ethylene-treated samples; Ca, carpel; Se, sepal; Pet, petal; Th, thalamus; Lf, leaf ; Pl, pedicel.

