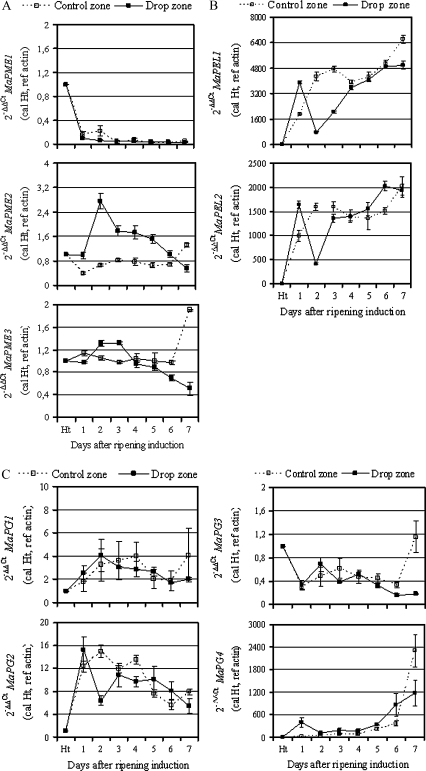
Fig. 3.
Expression of banana pectolytic genes in banana peel tissue from the control and drop zones. Quantitative real-time PCR (RT-qPCR) was used to analyse mRNA accumulation of banana pectolytic genes, including pectin methylesterase (A), pectate lyase (B), and polygalacturonase (C) in peel tissue sampled from the middle area (control zone) and rupture area (drop zone). The y-axis represents the relative fold difference in mRNA level and was calculated using the 2–ΔΔCt formula (Livak and Schmittgen, 2001) with actin as reference. The mRNA fold difference was relative to that of fruit taken at harvest time (Ht) used as calibrator. Each data point is the mean of values obtained from qPCR reactions performed in triplicate on one cDNA sample. Each sample was prepared from four fruits from three replicate bunches. Two biological experiments were performed and they gave similar results. Vertical bars indicate standard deviation (SD). When no bar is shown, the SD is smaller than the symbol.

