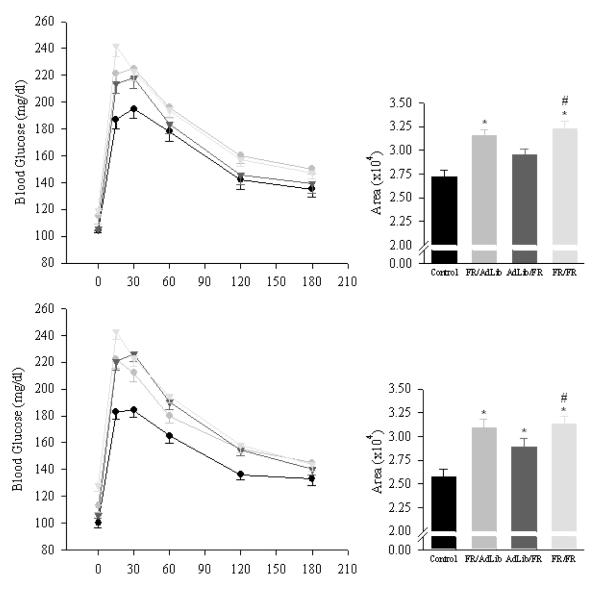
Figure 3.
Glucose tolerance test and area under the curve in 9 month old offspring. Data are shown of 6 males (upper panel) and 6 females (lower panel) from 6 litters from the control (solid circle), FR/AdLib (shaded circle), AdLib/FR (solid triangle) and FR/FR (shaded triangle) groups. * P < 0.01 vs. control offspring.

