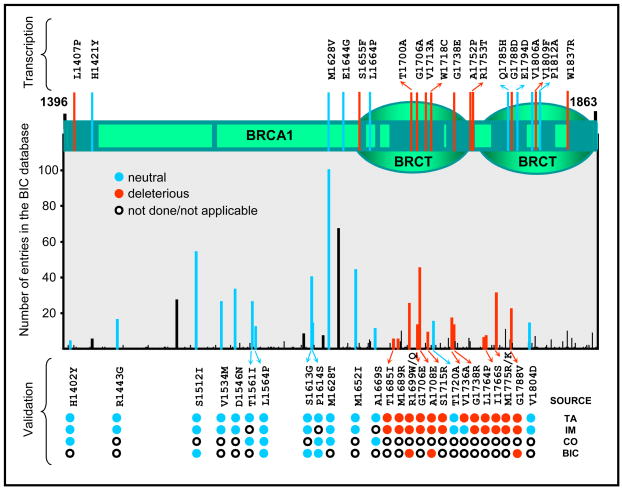
Fig. 5. Classification of missense variants in the carboxy-terminal region of BRCA1.
Top, Diagram of human BRCA1 depicting the carboxy-terminal region including the BRCT domains. Regions showing conservation above 0.75 in a multiple sequence alignment (from human to puffer fish) are shown as dark green boxes. Variants that have been tested by the transcription assay are indicated by red (deleterious) or blue (lines) but have not yet been classified by other integrative methods. Bottom, graph aligned to the top diagram shows the number of entries in the BIC database for each missense variants recorded to date. Bars record entries for all variants for a particular codon (number of entries for specific variant may be lower than what is shown because different substitutions may have been recorded). The lower part of the graph shows cross-validation of the transcription assay (TA) with integrative methods (IM), the BIC classification (BIC), or co-occurrence data (CO). Variants are shown as black (unclassified), red (deleterious), and blue (neutral) bars. All deleterious and neutral variants as classified in the BIC database are shown. Note preferential localization of deleterious variants in regions of recognized domains.

