
Figure 2. Body Weight of Mice Following DES Exposure.
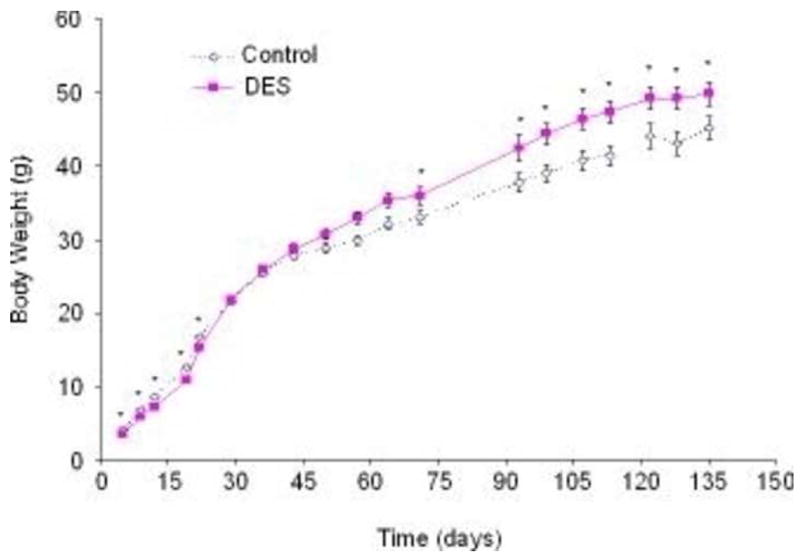
Body weights in grams plotted on the y axis were measured at various ages indicated on the x axis. Mice treated with DES (1000 μg/kg/day =1 mg/kg/day) had significantly lower body weights during treatment as compared to controls. By1 month, DES mice caught up to controls and by 2 months, they had surpassed the controls and gained a significantly higher body weight (n+16 mice per group); numbers are the mean ± S.E.M.; * denotes significance using ANOVA followed by Dunnett’s test (p <0.05). Data was published in (Newbold et al. 2007)