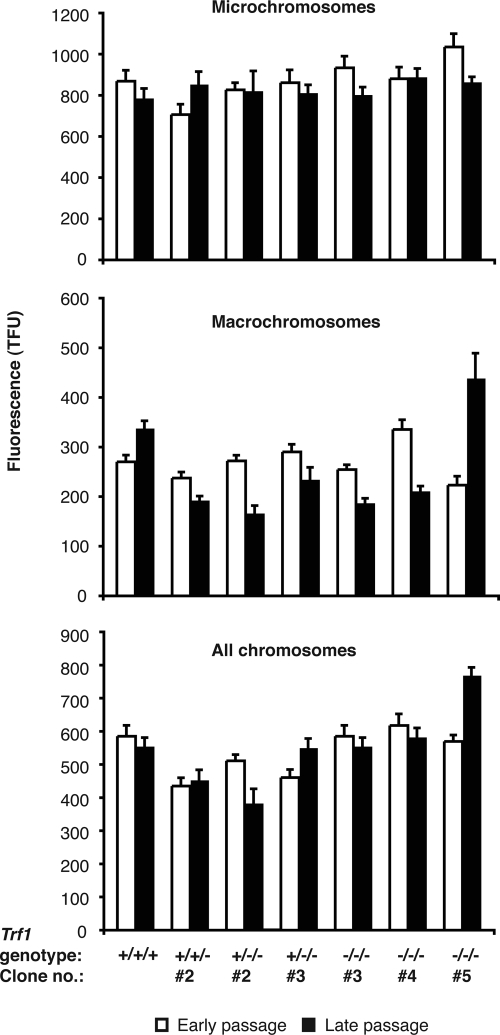
Figure 4.
Q-FISH analysis of (TTAGGG)n fluorescence of micro- and macro-chromosomes in wild-type DT40 and Trf1 mutant cell lines. A Cy3-conjugated PNA probe complementary to the (TTAGGG)n repeat array was hybridized to DAPI-stained metaphase spreads of DT40 cells of the indicated genotypes. Fluorescence intensities were measured at early passage (within 30 PD of the clonal cell line being established) and again at late passage (≈100 PDs later for all lines with the exception of one of the Trf1−/−/− mutants, which was resampled after only a further ∼50 PDs). Data were collected from as many chromosome ends as possible per metaphase spread and from between 200 and 800 metaphases for each cell line examined. (A) Fluorescence data for microchromosomes only, (B) for macrochromosomes only, and (C) pooled data for both micro- and macro-chromosomes. Values represent the mean ± SEM.

