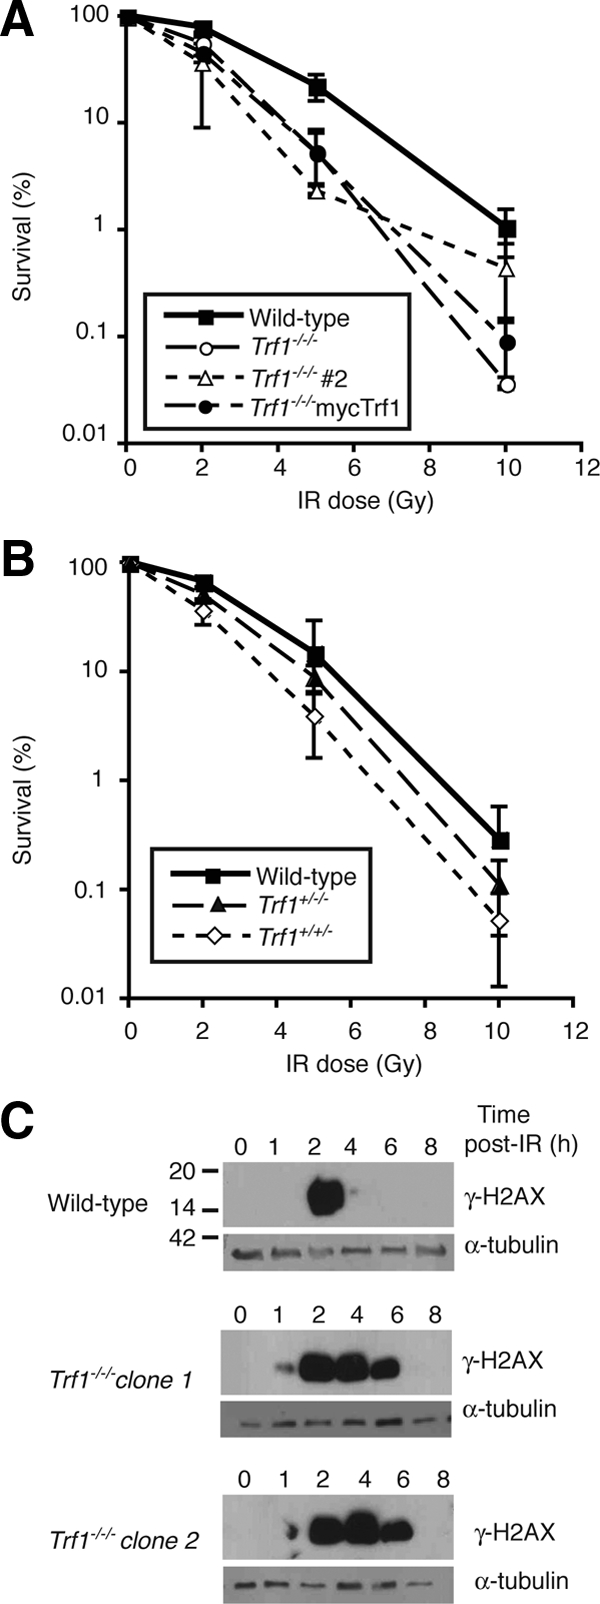
Figure 7.

Defective responses to ionizing radiation in Trf1-deficient cells. (A and B) Clonogenic survival of cells of the indicated genotype after treatment with different doses of γ-irradiation. Data points show mean ± SD of three separate triplicate experiments. (C) Immunoblot analysis of H2AX phosphorylation in cells of the indicated genotype at the indicated times after 10 Gy γ-irradiation. α-Tubulin is used as a loading control, and these blots are representative of three separate experiments. Indicative size markers are shown at left in kDa.
