Abstract
Omitting a stimulus from a train of repetitive stimuli, either by interrupting or by terminating the train, can elicit an electrophysiological response that occurs at the time appropriate for the omitted stimulus. This study investigated whether such an omitted stimulus response (OSR) is present in the flicker electroretinogram (ERG) of the human cone system. ERGs were recorded from 11 visually normal subjects in response to full-field sinusoidal flicker trains presented against a rod-desensitizing adapting field at frequencies ranging from 12.5 to 100 Hz. Recordings were synchronized with the onset of the stimulus trains, and the amplitude and relative delay of any additional ERG responses following the offset of the flicker train were analyzed. At stimulus frequencies below 35 Hz, the number of ERG responses always equaled the number of stimulus cycles. However, over the frequency range of 38.5 to 100 Hz, the ERG contained an extra response following flicker train offset. At stimulus frequencies from 38.5 to 62.5 Hz, there was a constant delay between the peak of the extra ERG response and the time at which the next stimulus would have occurred had the flicker train continued. This constant delay is characteristic of an OSR. In addition, an extra ERG response was apparent at these same stimulus frequencies if the flicker train was interrupted by omitting stimulus cycles from the middle of the train. The pattern of ERG findings is consistent with a recently proposed model of the OSR that attributes the phenomenon to a resonant oscillation in retinal bipolar cells.
Keywords: ERG, flicker, temporal frequency, cones, adaptation
Introduction
In many sensory modalities, omitting a stimulus from a train of repetitive stimuli may nevertheless elicit a neural response that is time-locked to the omitted stimulus, as discussed by Schwartz et al. (2007). In the human visual system, for example, Bullock et al. (1994) reported an extra response in the cortically-recorded visual evoked potential (VEP) when a stimulus was omitted from a flicker train or following the offset of the train (in the case of flicker train offset, the omitted stimulus refers to the next stimulus cycle had the flicker train continued). The extra response component in the VEP occurred at the time that a response would have been made if the omitted stimulus had actually been presented. Although the source of the omitted stimulus potential is not presently known, Bullock et al. (1994) suggested that it may arise at a site early within the visual pathway, perhaps at the level of the retina.
Consistent with this proposal, electrophysiological recordings have recently demonstrated the presence of an omitted stimulus response (OSR) in retinal ganglion cells of salamander and mouse (Schwartz et al., 2007; Schwartz & Berry, 2008). The OSR occurred when a stimulus was omitted from a train of repetitive stimuli and also following the offset of the train, although the emphasis of these studies was on the response following flicker train offset. Several different patterns of OSR were observed in retinal ganglion cells (Schwartz & Berry, 2008). Some cells showed no OSR, whereas others responded with a single burst of action potentials, or with an initial large burst followed by a second smaller burst, or with a “ringing” response. However, a key characteristic of the ganglion-cell OSR is that there was a constant delay between the time at which the omitted stimulus would have occurred and the time of the OSR, regardless of stimulus frequency. This constant delay across stimulus frequency has been interpreted as evidence that the OSR signals the omission of an expected stimulus (Schwartz et al., 2007). Although the exact retinal origin of the ganglion-cell OSR is uncertain, it has been proposed that the OSR may be generated by a resonant oscillation in retinal bipolar cells that is tuned to the stimulus frequency (Schwartz & Berry, 2008).
The purpose of the present study was to determine whether the human cone flicker ERG manifests an OSR. We had observed informally that the ERG response of the human cone system to a flicker train could sometimes exhibit an additional response component following the termination of the train. To investigate this observation more systematically, we examined the amplitude, timing, and frequency dependence of the extra ERG response following flicker train offset to determine whether it has the characteristics associated with an OSR. If this additional ERG response represents an OSR, then the delay from the omitted stimulus to the extra response should be constant across stimulus frequency, whereas the delay from the last actual stimulus to the extra response should be a decreasing function of stimulus frequency (Schwartz et al., 2007). The emphasis of the present study was on the ERG response following the offset of a flicker train in order to minimize any interaction that might occur between the OSR and the ERG response to the next actual stimulus following an omitted stimulus. Nevertheless, in an additional testing session, we specifically examined the effect of omitting one or two stimuli from the middle of the flicker train on the characteristics of the flicker ERG response.
Materials and Methods
Subjects
Ten visually normal subjects, 7 female and 3 male, ranging in age from 23 to 55 years, participated in the main study. An additional subject, male, age 28, provided data concerning the effect of omitting one or two stimulus cycles from the middle of a flicker train on the ERG. All subjects had best-corrected visual acuity of 20/20 or better in the tested eye as measured with the Lighthouse Distance Visual Acuity Test, normal letter contrast sensitivity as measured with the Pelli-Robson Contrast Sensitivity Chart, clear ocular media, and normal-appearing fundi on ophthalmologic examination. All experiments were approved by an institutional review board at the University of Illinois at Chicago, and written consent was obtained from each subject before testing.
Stimuli and Recording System
The stimulus consisted of full-field flicker that was a sum of middle-wavelength (512 nm) and long-wavelength (632 nm) light to minimize chromatic (red/green) adaptation (Kremers, 2003). Stimuli were presented in a Diagnosys ColorDome desktop Ganzfeld (Diagnosys LLC, Littleton, MA) and were generated by arrays of light-emitting diodes (LEDs) whose output was pulse-width-modulated at a frequency of 1 kHz in order to control the stimulus luminance. The luminance was modulated sinusoidally to avoid the change in mean luminance that can occur with the presentation of light pulses. Schwartz et al. (2007) reported that a ganglion-cell OSR could be observed with sinusoidal as well as with pulsed stimuli, and our pilot work confirmed that the human flicker ERG results were similar whether pulses or sinusoidal stimuli were used.
The stimulus mean luminance was 200 cd/m2 (4.0 log td, assuming a dilated pupil diameter of 8 mm), consisting of 100 cd/m2 each of the 512- and 632-nm stimuli. The stimulus was maintained at this mean luminance during the interstimulus interval. The flicker was presented against a steady, rod-saturating adapting field of 12.3 cd/m2 (2.8 log td or 3.3 log scot td), generated by an array of LEDs with a peak wavelength of 468 nm. This adapting field was also present during the interstimulus interval. Stimulus luminances and spectral characteristics were calibrated with a PR-650 SpectraScan colorimeter (Photo Research, Inc., Chatsworth, CA), with luminances based on V10λ. Stimulus contrast (C) was defined as:C = (Lmax − Lmin)/(Lmax + Lmin), where Lmax and Lmin are the maximum and minimum luminances of the sinusoidal flicker, respectively. The nominal stimulus contrast was 100%, but the effective stimulus contrast was 94.2% when presented against the short-wavelength adapting field.
ERG responses were recorded with a Burian-Allen bipolar contact lens electrode wetted with methylcellulose and grounded with an earclip electrode. Signals were acquired with a Diagnosys Espion electrophysiology console, using amplifier band-pass settings of 0.3 to 500 Hz without a 60-Hz notch filter, and a sampling frequency of 2 kHz.
Procedure
Prior to the ERG recordings, the pupil of the tested eye was dilated with 2.5% phenylephrine hydrochloride and 1% tropicamide drops, and the cornea was anesthetized with proparacaine drops. Each subject was light-adapted to room illumination prior to testing. Following electrode insertion, subjects adapted to the stimulus mean luminance for 5 minutes to achieve a stable level of light adaptation before the ERG recording began. ERG responses of each subject were obtained within a single recording session.
ERG responses were recorded to stimuli ranging in frequency from 12.5 to 100 Hz, and stimuli were presented in order of increasing frequency within the session. The onset of each ERG recording was synchronized with the start of the stimulus in order to maintain the appropriate phase relationship between successive recordings. For the main study, a continuous flicker train was presented for approximately 1 s (the exact duration was an even multiple of the stimulus period), and each recording was continued for an additional six stimulus periods following the termination of the flicker train. In a supplementary experiment, ERG recordings were obtained to flicker trains with either one or two stimulus cycles omitted from the middle. In this experiment, the duration of the flicker train was approximately 400 ms both before and after the omitted cycle(s) (the exact duration was an even multiple of the stimulus period). In all cases, ERG responses were recorded to at least three stimulus presentations at each frequency, and analyses were based on the means of the three responses with the least noise and eye movement artifacts.
Results
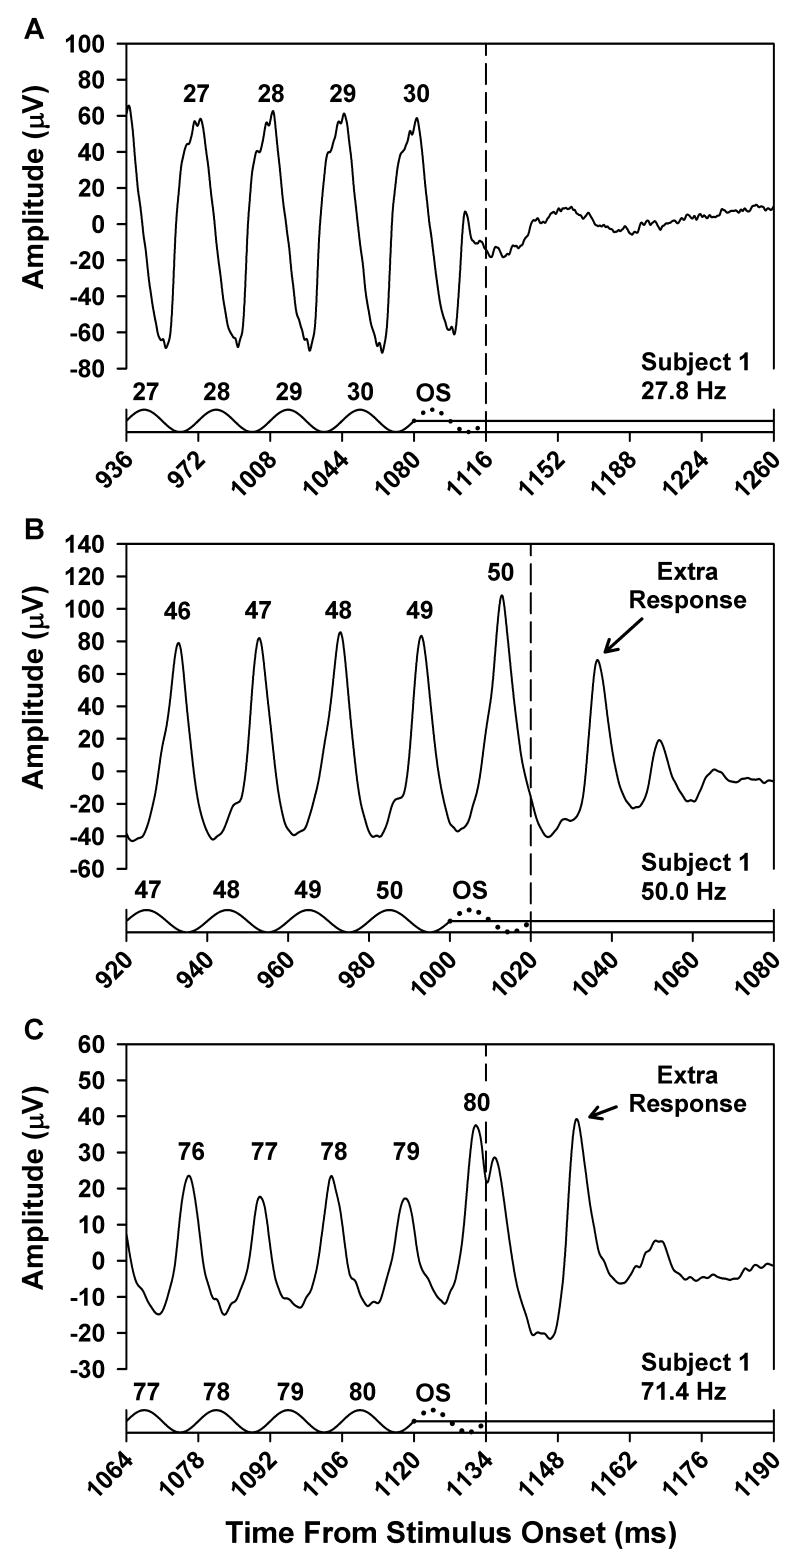
Fig. 1 presents the mean ERG responses of a representative subject obtained at stimulus frequencies of 27.8 (A), 50.0 (B), and 71.4 (C) Hz. For clarity, only the ERG responses to the last few stimulus cycles are shown. Each time base is plotted in multiples of the stimulus period, and the stimulus waveforms are shown as the solid tracings along the abscissas. The numbers above the stimulus peaks refer to the respective cycle numbers in the flicker train, and the corresponding response peaks are numbered accordingly. The dotted cycle following the last actual stimulus cycle in each plot represents the omitted stimulus, and the vertical dashed lines indicate the time at which the omitted stimulus would have ended.
Fig. 1.
Mean ERG responses of Subject 1 to the last few cycles of a flicker train presented at a frequency of 27.8 Hz (A), 50.0 Hz (B), or 71.4 Hz (C). The x-axis in each plot represents the time from stimulus onset and is labeled in increments of the stimulus period. Stimulus waveforms are given below the responses. Stimulus peaks are numbered according to their position in the flicker train, and numbers above the response peaks correspond to the respective stimulus cycles. The dotted cycle in each plot represents the omitted stimulus, and the vertical dashed line indicates its termination.
At a stimulus frequency of 27.8 Hz (Fig. 1A), the number of ERG response peaks was equal to the number of stimulus cycles (the small positive-going response component just prior to the dashed line represents the response to the rising portion of the last stimulus cycle). At a stimulus frequency of 50.0 Hz (Fig. 1B), however, the number of ERG responses exceeded the number of stimulus cycles. Following the flicker train offset, there was a relatively prominent additional response peak followed by two smaller peaks, suggestive of a damped oscillation. At a stimulus frequency of 71.4 Hz (Fig. 1C), the overall ERG response amplitude was less than at the other two stimulus frequencies, but there was still an extra response following flicker train offset.
Also apparent in the ERG response at 71.4 Hz was the phenomenon of period doubling, which refers to an alternation in the waveform shape from cycle to cycle (Crevier & Meister, 1998). That is, responses 77 and 79 were of lower amplitude than responses 76 and 78, and this alternation in amplitude was evident throughout the waveform. Period doubling was also evident in the ERG response at 50.0 Hz, where it was manifested as a subtle alternation in the shape of the rising portion of the waveform for response cycles 46 through 49. This alternation in waveform morphology occurred throughout the entire ERG waveform. The possible relationship between period doubling and the extra response following flicker train offset is considered in the Discussion.
The frequency-dependence of the extra ERG response following the flicker train offset that was observed in this subject was characteristic of all the subjects. That is, at stimulus frequencies of 27.8 Hz and lower, the number of ERG responses was equal to the number of stimulus cycles for all of the subjects. At stimulus frequencies of 38.5 Hz and above, all subjects showed an extra ERG response following the offset of the flicker train. At stimulus frequencies between 27.8 Hz and 38.5 Hz, an increasing proportion of subjects showed an extra ERG response following the flicker train offset as the stimulus frequency increased.
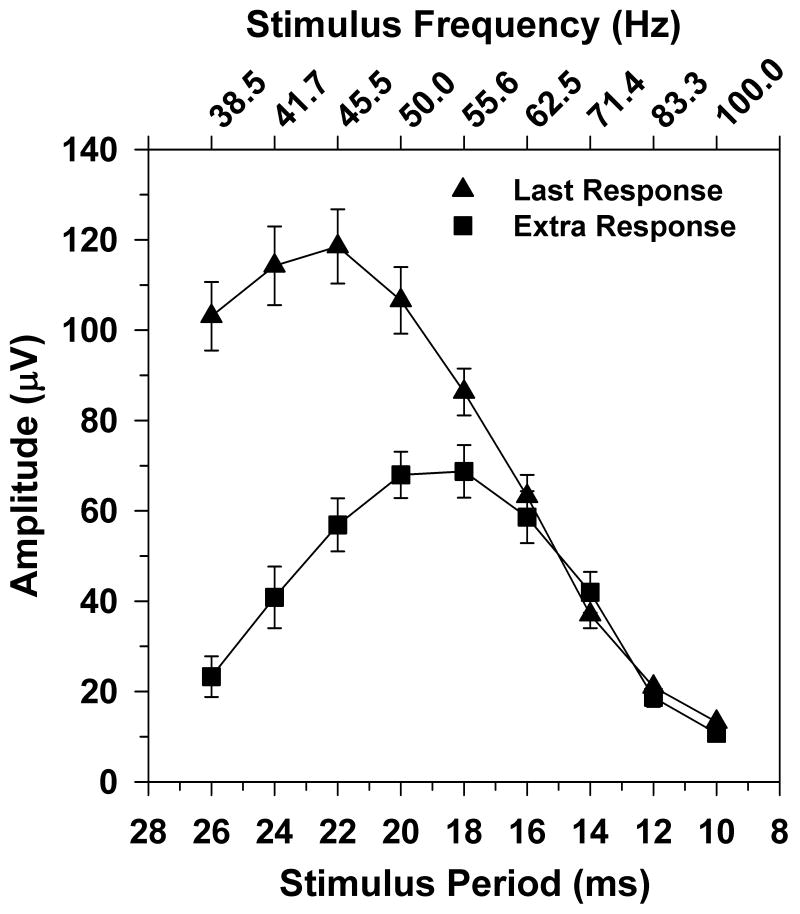
The mean trough-to-peak amplitude of the extra ERG response for 10 subjects is plotted in Fig. 2 (squares) as a function of stimulus period. The corresponding stimulus frequencies are given on the top x-axis. Data are plotted only at those stimulus frequencies for which all subjects showed a measurable additional response peak following the offset of the flicker train (i.e., 38.5 Hz and higher). The frequency-response function for this extra ERG response was strongly band-pass, with an amplitude peak between 50.0 and 55.5 Hz. For comparison, Fig. 2 also plots the mean amplitude of the response to the last stimulus cycle (triangles) as a function of stimulus period. This frequency-response function was also band-pass, but the peak was at a lower stimulus frequency than for the extra response. In addition, the amplitude of the response to the last stimulus cycle was greater than that of the extra response for stimulus frequencies below 60 Hz, whereas the amplitudes of both responses were similar at stimulus frequencies above that value.
Fig. 2.
Mean trough-to-peak amplitude of the extra ERG response (squares) and response to the last stimulus cycle (triangles) as a function of stimulus period for 10 subjects. Corresponding stimulus frequencies are indicated on the upper x-axis. Error bars represent ±1 standard error of the mean (SEM).
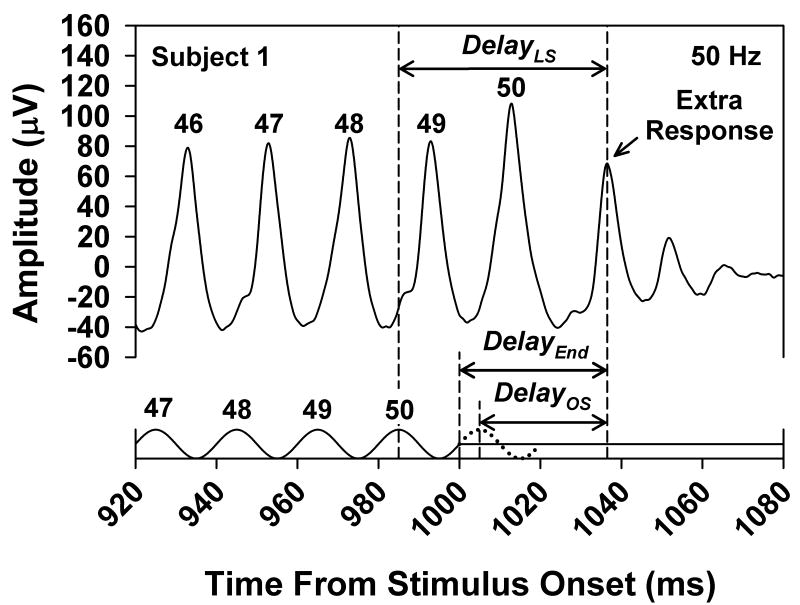
Three measures of the delay of the extra ERG response were derived, as illustrated in Fig. 3. This figure presents the ERG response of Subject 1 at a stimulus frequency of 50.0 Hz, replotted from Fig. 1. As indicated by the arrow, DelayOS was defined as the delay between the peak of the omitted stimulus (which is indicated by the dotted stimulus cycle) and the peak of the extra response. DelayLS was defined as the delay from the peak of the last actual stimulus cycle (labeled “50”) to the peak of the extra response. DelayEnd was defined as the delay from the end of the stimulus to the peak of the extra response and was a quarter-cycle longer than DelayOS.
Fig. 3.
Illustration of the three ways in which the delay of the extra response was defined, with reference to the 50.0-Hz flicker ERG of Subject 1, which is replotted from Fig. 1. DelayOS, DelayLS and DelayEnd were measured from the peak of the extra response to the peak of the omitted stimulus (indicated by the dotted cycle), to the peak of the last stimulus cycle, or to the end of the stimulus train, respectively.
If the extra ERG response following the offset of the flicker train represents an OSR, then it is expected that DelayOS would be constant across stimulus period and DelayLS should decrease systematically with decreasing stimulus period (Schwartz et al., 2007). On the other hand, if the peak of the extra response follows the last actual stimulus cycle by a fixed delay, then DelayLS would be constant across stimulus period. However, if the extra response represents a response to the termination of the flicker train, then DelayEnd would be constant across stimulus period.
The mean values for the three delay measurements are plotted in Fig. 4, with the data plotted as a function of decreasing stimulus period (increasing stimulus frequency). DelayOS (diamonds) was constant across the frequency range of 38.5 Hz to 62.5 Hz (leftmost six data points) but became shorter at the three highest frequencies. The slope of a least-squares regression line fit to the leftmost six data points was 0.04, which is not significantly different from 0 (t = 0.90, p = 0.41). Such a constant value of DelayOS would be expected if the extra ERG response represents an OSR. On the other hand, DelayLS (circles) became systematically shorter as the stimulus period decreased. The slope of a least-squares regression line fit to the leftmost six data points was -1.04, which is not significantly different from -1 (t = 0.90, p = 0.41). This is the result to be expected if the extra ERG response represented an OSR. Based on these results, the dashed vertical lines in Fig. 4 indicate the frequency region over which the properties of DelayOS and DelayLS were consistent with those of an OSR.
Fig. 4.
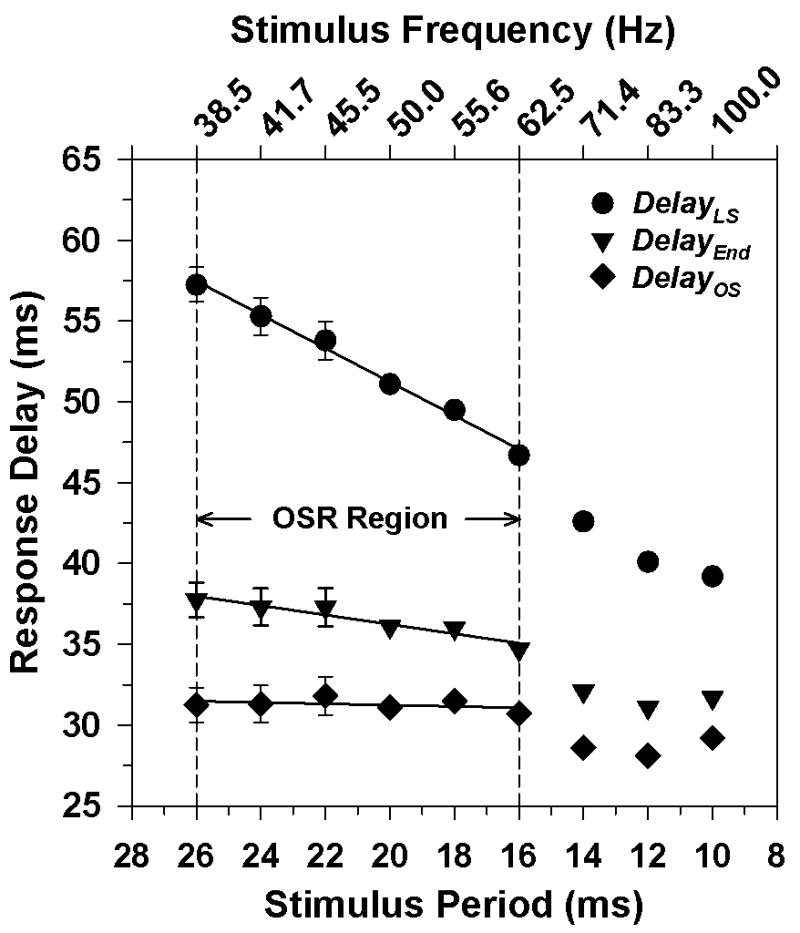
Mean DelayLS (circles), mean DelayEnd (inverted triangles), and mean DelayOS (diamonds) as a function of stimulus period for 10 subjects. The corresponding stimulus frequencies are indicated on the upper x-axis. Error bars represent ±1 SEM. The lines are least-squares regression lines fit to the leftmost six data points for each condition. Vertical dashed lines demarcate the frequency region over which the delay of the extra response was consistent with that of an OSR.
The data in Fig. 4 also indicate that the extra response following the termination of the flicker train was not simply a response to the flicker train offset. The slope of the function relating DelayEnd to stimulus period for the six leftmost data points had a slope of 0.29, which is significantly different from zero (t = 6.43, p < 0.01). Thus, there was not a constant delay between the offset of the flicker train and the peak of the extra response.
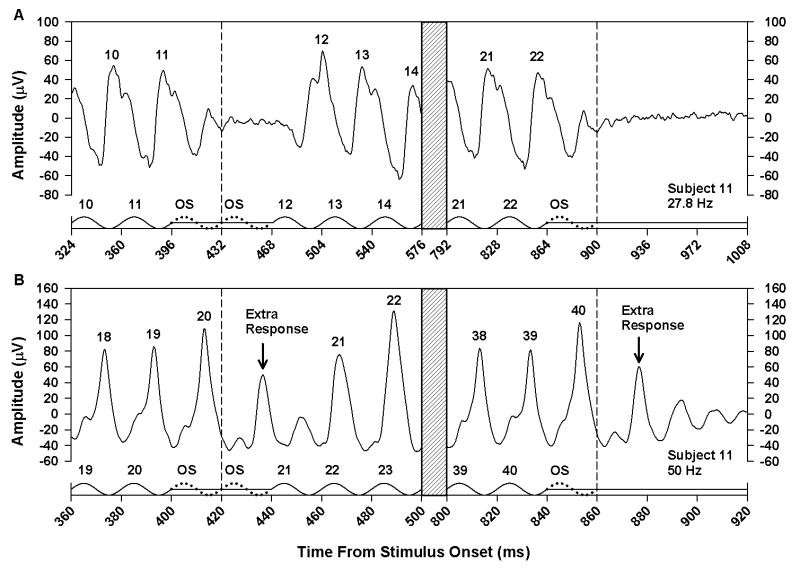
In a supplementary study, we examined the effect of omitting one or two stimulus cycles from the middle of a flicker train. The effect of omitting one stimulus cycle is illustrated in Fig. 5 for Subject 11 at stimulus frequencies of 27.8 and 50.0 Hz. Fig. 6 presents the results of omitting two consecutive stimulus cycles for the same subject. For comparison, each figure also shows the ERG response of this subject following the termination of the flicker train. At a stimulus frequency of 27.8 Hz (Figs. 5A and 6A), there was no ERG response to an omitted stimulus, and the number of ERG responses was equal to the number of stimulus cycles. However, at 50.0 Hz (Figs. 5B and 6B), an extra ERG response was apparent between the responses to stimulus cycles 20 and 21. With a single omitted stimulus (Fig. 5B), the amplitude of the extra response was smaller than the extra response following stimulus offset because it was interrupted by the negative-going portion of the response to the next actual stimulus cycle. With two omitted stimuli (Fig. 6B), there was a more complete expression of the OSR, so that the ERG response closely resembled the response following stimulus offset.
Figure 5.
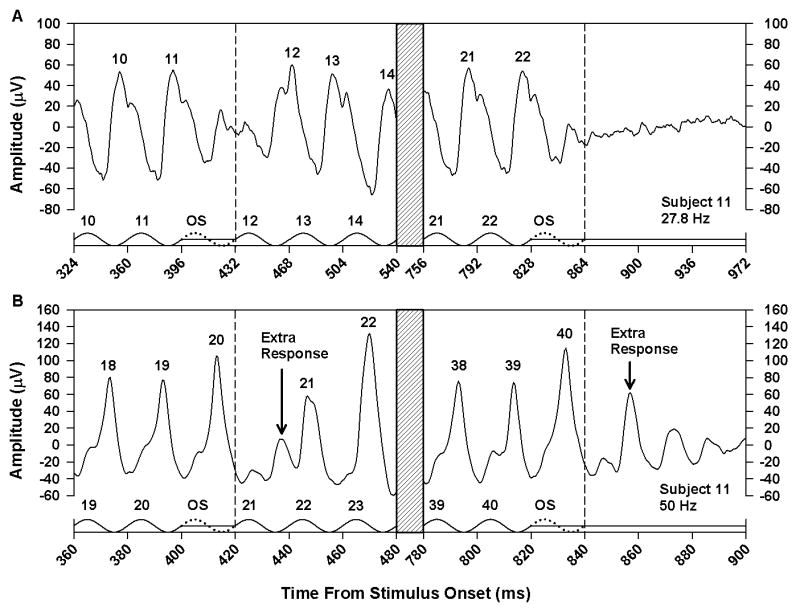
Mean ERG responses of Subject 11 to the middle (left) and end (right) of a flicker train with one stimulus cycle omitted from the middle of the train, presented at a frequency of 27.8 Hz (A) or 50.0 Hz (B). The x-axis in each plot represents the time from stimulus onset and is labeled in increments of stimulus period. Hatched regions indicate portions of the stimulus and response that were omitted from the plot for clarity. Stimulus waveforms are given below the responses. Stimulus peaks are numbered according to their position in the flicker train, and numbers above the response peaks correspond to the respective stimulus cycles. The dotted cycles represent the omitted stimulus, and the vertical dashed lines indicate the termination of the omitted stimulus.
Figure 6.
Mean ERG responses of Subject 11 under the same conventions as for Fig. 5, except that two stimulus cycles were omitted from the middle of the flicker train.
Discussion
The aim of this study was to determine whether the flicker ERG of the human cone system exhibits an OSR. Our results are consistent with the presence of an OSR across the frequency range of 38.5 to 62.5 Hz. Over this frequency range, there was an additional ERG response following the termination of the flicker train. DelayOS, which was measured from the peak of the omitted stimulus to the peak of this extra response, was constant across this frequency region, which is a primary characteristic of an OSR (Schwartz et al., 2007). In addition, an extra ERG response was apparent when one or two stimulus cycles were omitted from the middle of a flicker train. The frequency range of the OSR in the human flicker ERG is higher than the range of approximately 6 to 20 Hz observed in mouse retinal ganglion cells (Schwartz et al., 2007). Taking into account the different frequency ranges of the mouse and human flicker ERG (Krishna, et al., 2002), the OSR in the human ERG occurs at a proportionally higher stimulus frequency than the ganglion-cell OSR in mouse.
Of note, DelayOS was approximately 5 ms longer than the average delay between each stimulus peak of the flicker train and the corresponding ERG response peak. Similarly, in retinal ganglion cell recordings, the delay between the omitted stimulus and the OSR was slightly longer than the delay between each stimulus and the corresponding response during a flicker train (Schwartz et al., 2007). The explanation for this additional response delay remains to be determined.
As shown in Fig. 2, there was also an extra response following the termination of the flicker train for stimulus frequencies greater than 62.5 Hz. However, DelayOS was not constant across this high-frequency region, indicating that the extra response was not consistent with an OSR. In addition, DelayOS was shorter at these high frequencies than for frequencies less than 62.5 Hz (Fig. 4). In other respects, as well, the high-frequency flicker ERG of the human cone system has properties different from those recorded at lower frequencies, including an absence of Weber-law behavior at different adapting luminances (Wu & Burns, 1996), a linear contrast-response function (Wu et al., 1995) and a change in fundamental phase compared to lower frequencies indicative of a shorter response latency (Alexander, et al., 2006). Therefore, it might be expected that flicker ERG responses following the termination of a stimulus train would differ across the higher and lower frequency regions.
Based on pharmacologic data, Schwartz and Berry (2008) concluded that ON bipolar cells are necessary for the generation of an OSR in retinal ganglion cells of mouse and salamander. They proposed that the ganglion-cell OSR may be due to a stimulus-induced oscillation in ON bipolar cells that continues for a brief period following the offset of the stimulus train, whereas the response of OFF bipolar cells terminates. These investigators suggested that the resonant frequency of the ON bipolar cells may be tuned to the stimulus frequency by a second messenger such as calcium.
Our ERG results are consistent with the proposal of Schwartz and Berry (2008). At the temporal frequencies for which there is an apparent OSR in the human flicker ERG, the flicker ERG of the primate cone system contains a large component that is generated by retinal bipolar cells (Kondo & Sieving, 2001; Viswanathan, et al., 2002). Furthermore, across this frequency region, the APB-sensitive or ON bipolar cells tend to dominate the ERG response (Kondo & Sieving, 2001). In addition, the waveform characteristics of the OSR in the human flicker ERG were suggestive of the response of a damped oscillator. That is, there were multiple response peaks of decreasing amplitude in the flicker ERG following flicker train offset, as observed in Figs. 1B, 5B, and 6B.
Schwartz and Berry (2008) observed that mouse ganglion cell responses could show period doubling under conditions that resulted in an OSR. Similarly, we observed period doubling in the flicker ERGs plotted in Figs. 1B, 1C, 5B, and 6B. Period doubling and the OSR both reflect nonlinearities in the generators of the flicker ERG. However, there appear to be fundamental differences between the two phenomena. Period doubling in the human ERG occurs over the stimulus frequency range of 25 to 100 Hz, with a maximum amplitude at a stimulus frequency of approximately 36 Hz (Alexander et al., 2008). In comparison, the OSR first became apparent at a stimulus frequency of approximately 38 Hz and extended to approximately 63 Hz (Fig. 4). In addition, it is likely that the underlying neural mechanisms are different. It has been proposed that period doubling results from a nonlinear feedback mechanism involving cone photoreceptors and OFF bipolar cells (Crevier & Meister, 2001). As noted above, the OSR may involve a resonant oscillation in ON bipolar cells (Schwartz & Berry, 2008). Therefore, it appears likely that there is no direct relationship between these two forms of retinal nonlinearity, but this remains to be resolved.
In summary, the human cone flicker ERG contains an additional response component following the termination of a train of sinusoidal stimuli for frequencies higher than 38 Hz. Across the frequency range of approximately 38 to 62 Hz, the delay between the final stimulus in the train and the peak of the additional response was not constant but varied linearly with stimulus period, indicating that the additional response was not generated by the final stimulus. Furthermore, there was not a constant delay between the end of the stimulus train and the extra response, which indicates that the additional response was not a response to stimulus offset. Instead, there was a constant delay between the omitted stimulus (i.e., the next stimulus cycle had the flicker train continued) and the additional ERG response. This constant delay is characteristic of an OSR. In addition, there was an extra ERG response when a stimulus cycle was omitted from the middle of a flicker train, which is also characteristic of an OSR. The ERG data of the present study are consistent with a recent model which attributes the OSR observed in mouse and salamander ganglion cell responses to a stimulus-tuned resonant oscillation in retinal bipolar cells (Schwartz & Berry, 2008).
Acknowledgments
This research was supported by NIH research grant EY008301 (KRA), NIH Core Grant EY001792, and a Senior Scientific Investigator Award (KRA) and unrestricted departmental grant from Research to Prevent Blindness. We thank Dr. Aparna Raghuram for obtaining the ERG data.
References
- Alexander KR, Rajagopalan AS, Raghuram A, Fishman GA. Activation phase of cone phototransduction and the flicker electroretinogram in retinitis pigmentosa. Vision Research. 2006;46:2773–2785. doi: 10.1016/j.visres.2006.01.007. [DOI] [PubMed] [Google Scholar]
- Alexander KR, Raghuram A, McAnany JJ. Comparison of spectral measures of period doubling in the cone flicker electroretinogram. Documenta Ophthalmologica. 2008;117:197–203. doi: 10.1007/s10633-008-9123-z. [DOI] [PMC free article] [PubMed] [Google Scholar]
- Bullock TH, Karamürsel S, Achimowicz JZ, McClune MC, Başar-Eroglu C. Dynamic properties of human visual evoked and omitted stimulus potentials. Electroencephalography and Clinical Neurophysiology. 1994;91:42–53. doi: 10.1016/0013-4694(94)90017-5. [DOI] [PubMed] [Google Scholar]
- Crevier DW, Meister M. Synchronous period-doubling in flicker vision of salamander and man. Journal of Neurophysiology. 1998;79:1869–1878. doi: 10.1152/jn.1998.79.4.1869. [DOI] [PubMed] [Google Scholar]
- Kondo M, Sieving PA. Primate photopic sine-wave flicker ERG: vector modeling analysis of component origins using glutamate analogs. Investigative Ophthalmology and Visual Science. 2001;42:305–312. [PubMed] [Google Scholar]
- Kremers J. The assessment of L- and M-cone specific electroretinographical signals in the normal and abnormal human retina. Progress in Retinal and Eye Research. 2003;22:579–605. doi: 10.1016/s1350-9462(03)00049-1. [DOI] [PubMed] [Google Scholar]
- Krishna VR, Alexander KR, Peachey NS. Temporal properties of the mouse cone electroretinogram. Journal of Neurophysiology. 2002;87:42–48. doi: 10.1152/jn.00489.2001. [DOI] [PubMed] [Google Scholar]
- Schwartz G, Berry MJ. Sophisticated temporal pattern recognition in retinal ganglion cells. Journal of Neurophysiology. 2008;99:1787–1798. doi: 10.1152/jn.01025.2007. [DOI] [PMC free article] [PubMed] [Google Scholar]
- Schwartz G, Harris R, Shrom D, Berry MJ. Detection and prediction of periodic patterns by the retina. Nature Neuroscience. 2007;10:552–554. doi: 10.1038/nn1887. [DOI] [PMC free article] [PubMed] [Google Scholar]
- Viswanathan S, Frishman LJ, Robson JG. Inner-retinal contributions to the photopic sinusoidal flicker electroretinogram of macaques. Documenta Ophthalmologica. 2002;105:223–242. doi: 10.1023/a:1020505104334. [DOI] [PubMed] [Google Scholar]
- Wu S, Burns SA. Analysis of retinal light adaptation with the flicker electroretinogram. Journal of the Optical Society of America A. 1996;13:649–657. doi: 10.1364/josaa.13.000649. [DOI] [PubMed] [Google Scholar]
- Wu S, Burns SA, Elsner AE. Effects of flicker adaptation and retinal gain control on the flicker ERG. Vision Research. 1995;35:2943–2953. doi: 10.1016/0042-6989(95)00087-g. [DOI] [PubMed] [Google Scholar]


