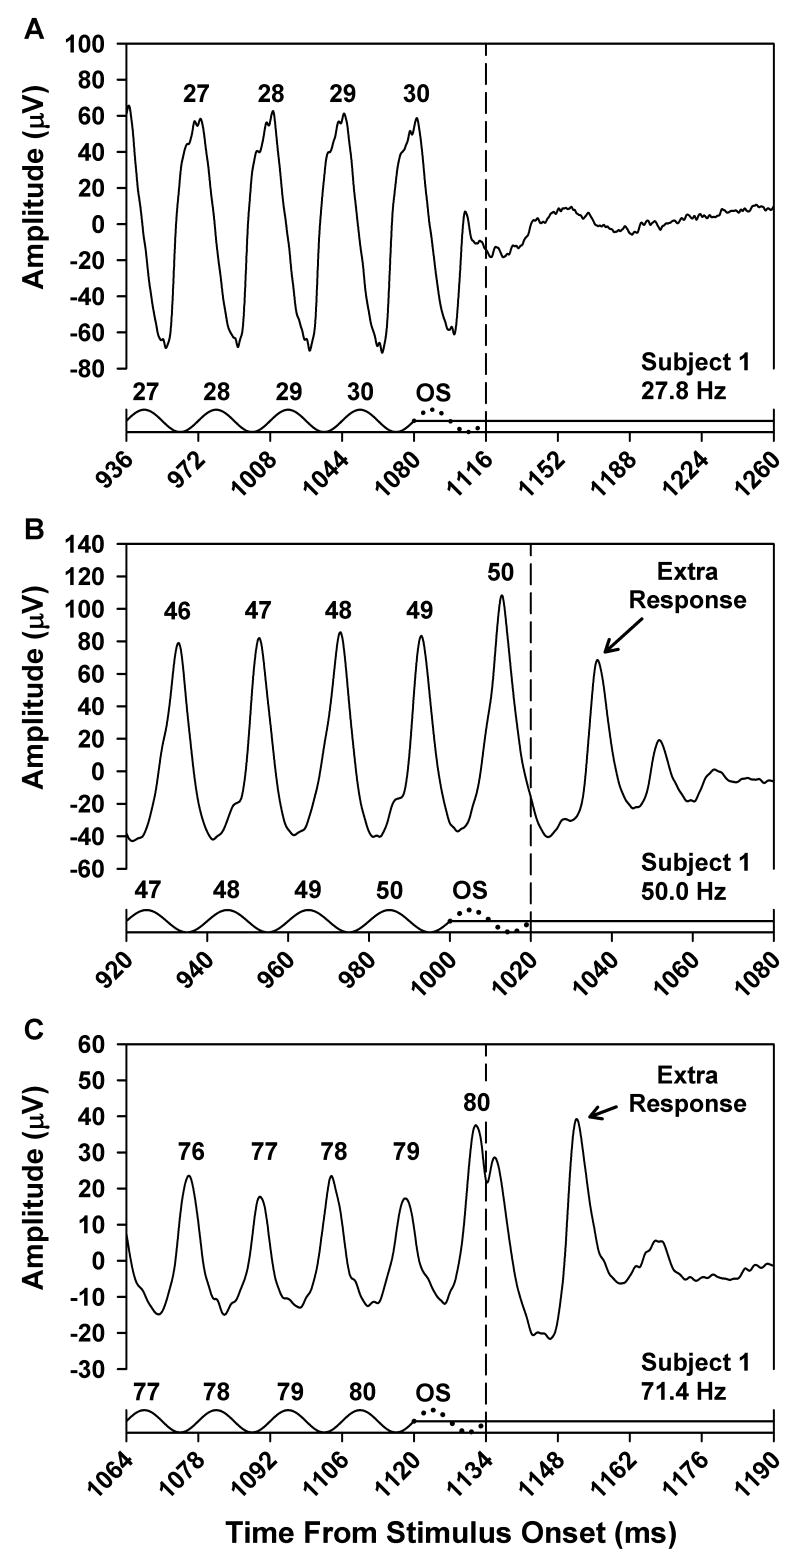
Fig. 1.
Mean ERG responses of Subject 1 to the last few cycles of a flicker train presented at a frequency of 27.8 Hz (A), 50.0 Hz (B), or 71.4 Hz (C). The x-axis in each plot represents the time from stimulus onset and is labeled in increments of the stimulus period. Stimulus waveforms are given below the responses. Stimulus peaks are numbered according to their position in the flicker train, and numbers above the response peaks correspond to the respective stimulus cycles. The dotted cycle in each plot represents the omitted stimulus, and the vertical dashed line indicates its termination.

