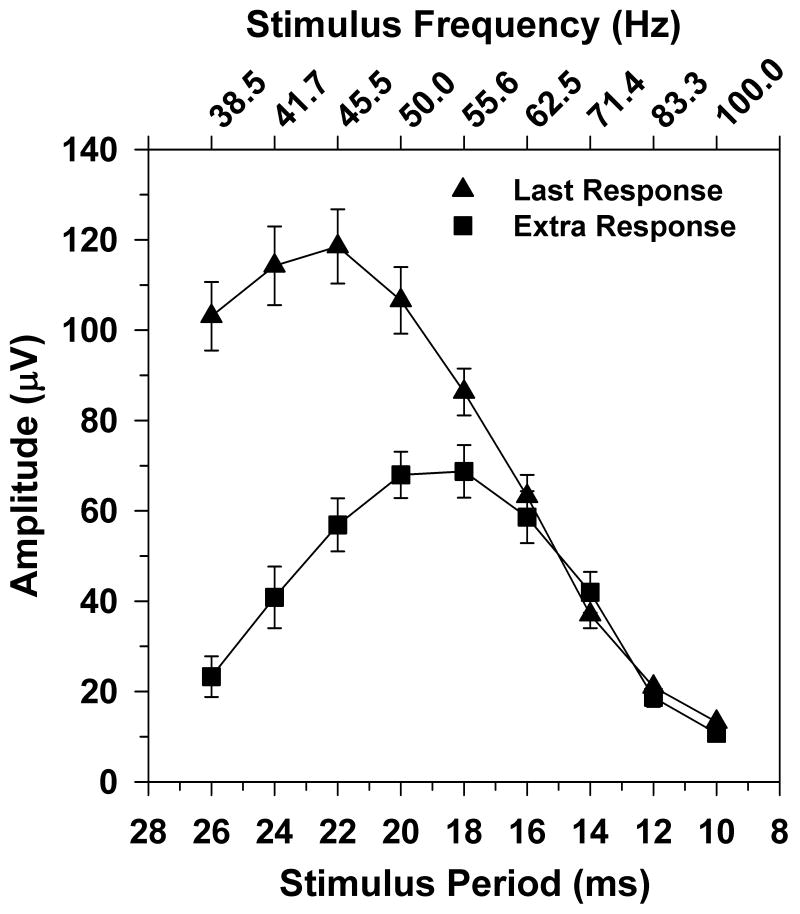
Fig. 2.
Mean trough-to-peak amplitude of the extra ERG response (squares) and response to the last stimulus cycle (triangles) as a function of stimulus period for 10 subjects. Corresponding stimulus frequencies are indicated on the upper x-axis. Error bars represent ±1 standard error of the mean (SEM).

