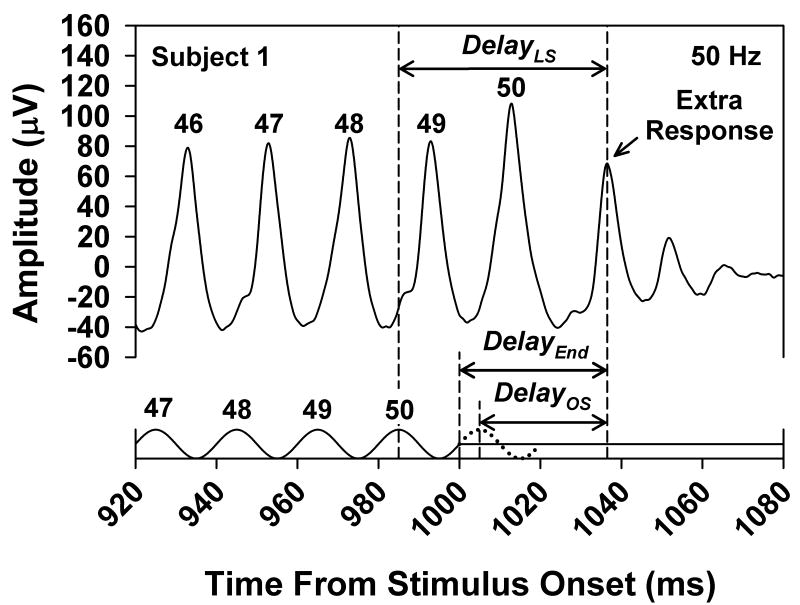
Fig. 3.
Illustration of the three ways in which the delay of the extra response was defined, with reference to the 50.0-Hz flicker ERG of Subject 1, which is replotted from Fig. 1. DelayOS, DelayLS and DelayEnd were measured from the peak of the extra response to the peak of the omitted stimulus (indicated by the dotted cycle), to the peak of the last stimulus cycle, or to the end of the stimulus train, respectively.

