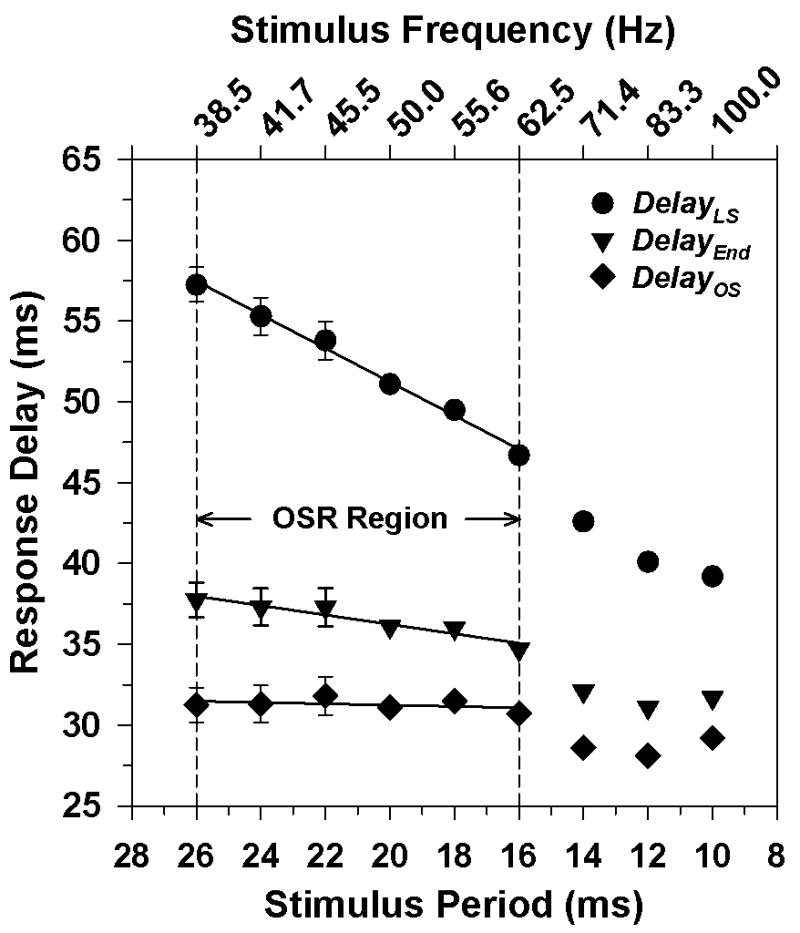
Fig. 4.

Mean DelayLS (circles), mean DelayEnd (inverted triangles), and mean DelayOS (diamonds) as a function of stimulus period for 10 subjects. The corresponding stimulus frequencies are indicated on the upper x-axis. Error bars represent ±1 SEM. The lines are least-squares regression lines fit to the leftmost six data points for each condition. Vertical dashed lines demarcate the frequency region over which the delay of the extra response was consistent with that of an OSR.
