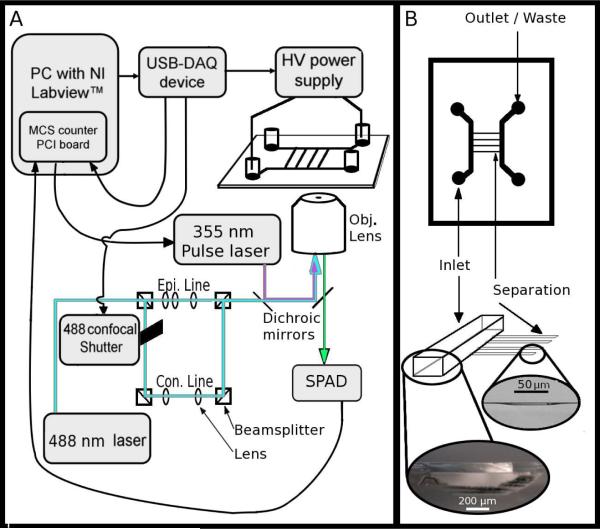
Figure 1.
(A) A schematic diagram of the instrument, including the connections among the modules and essential optics. The USB-DAQ triggers the opening of a mechanical shutter for confocal illumination then activates the HV power supply. Once the power supply has reached full voltage, the USB-DAQ board triggers the MCS card (which is located in the PC). The MCS card records the photon counts from the single photon avalanche diode (SPAD); at 50% time of the full data collection run, the MCS card sends a TTL pulse to the nanosecond pulsed UV laser to initiate photolysis. The 488 nm laser is shuttered such that while aiming, it is configured for epi-fluorescence (to show the location of all mitochondria within the field of view), and during data acquisition it is configured for line confocal detection with the SPAD. Epi. indicates epifluorescence optics, Con. indicates confocal optics, Obj. indicates objective lens. (B) Schematic and images showing the essential elements of the microfluidic chip design including the 750 μm wide, 120 μm deep inlet and outlet channels and the 50 μm wide, ~1 μm deep separation channels. Light micrographs of the two respective side profiles are shown at bottom.

