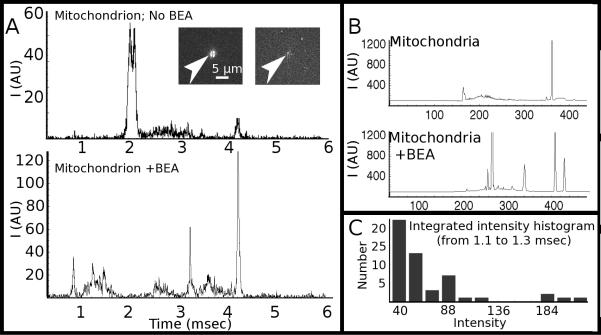
Figure 5.
(A) Single-mitochondrion electropherograms obtained without the use of benzylethanolamine (BEA) (top trace) and with BEA (bottom trace). Inset shows before and after photolysis of a mitochondrion prior to capillary-electrophoresis separation. (B) Bulk electropherograms of mitochondrial lysate without (top) and with (bottom) BEA in the labeling step. (C) Histogram of integrated photon counts from 1.1 to 1.3 msec, which shows a multi-modal distribution among those mitochondria displaying a peak at this retention time.

