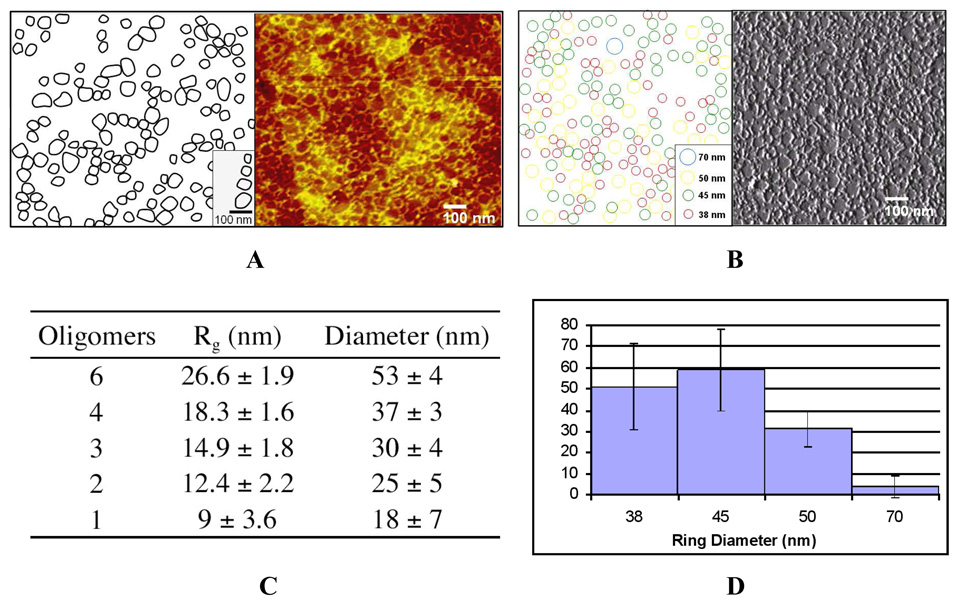
Figure 4.
AFM ring size quantification of protein nanorings on TS-Au. (A, right) Height data showing apparent rings dispersed across a TS-Au surface (A, left) Schematic representation of rings from masking and their four representative diameters (B) Binned amplitude dataset to the four observed sizes in 4A with schematic (C) Nanoring sizes as from SLS of collected SEC fraction used for AFM study and (D) Quantification of AFM images gathered from 5 samplings of 3.292 um2 total surface area showing predominantly 4–6 oligomer sized nanorings on the TS-Au surface.

