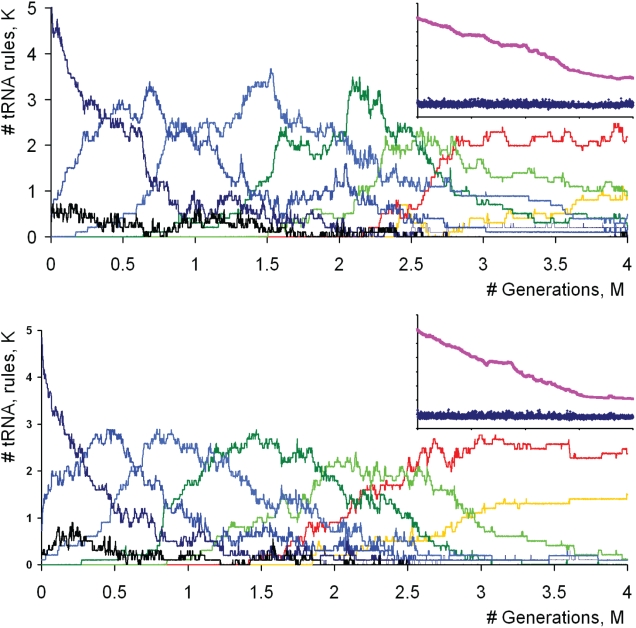
Figure 2. Dynamics of codon sizes in an evolving population of coding systems starting with octuplet genetic codes.
Each curve correspond to the number of tRNA rules of a particular size (axis y, factored by thousand, K) in the entire population of the coding systems over time (axis x, number of generations factored my million, M). Curves are differentially colored depending on the codon length as the following: black – 9, dark blue – 8; blue – 7; light blue – 6, dark green – 5, light green – 4, red – 3, yellow – 2, violet – 1. Two simulations with different random starting conditions are shown. Small plots in the top right corners of the main plots show the replication rate of coding systems (dark blue) and the size of mRNA sequence (magenta). Supplementary Movie S1 shows an animated histogram of codon evolution and mRNA length change for the simulation corresponding to the plot at the bottom.

