FIG. 5.
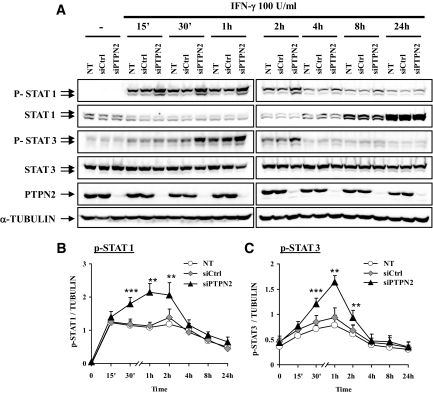
PTPN2 inhibition increases IFN-γ–induced STAT1 and STAT3 phosphorylation. INS-1E cells were left untransfected (NT) or transfected with 30 nmol/l of either a control siRNA (siCtrl) or with a pool of siRNAs targeting PTPN2 (siPTPN2). After 2 days of recovery, cells were left untreated or treated with IFN-γ (100 units/ml) for 15 min, 30 min, 1 h, 2 h, 4 h, 8 h, and 24 h. A: phospho-STAT1, total STAT1, phospho-STAT3, total STAT3, PTPN2, and α-tubulin proteins were evaluated by Western blot. These results are representative of five independent experiments. B and C: Mean optical density measurements of phospho-STAT1 (B) and phospho-STAT3 (C) Western blots corrected for protein loading by α-tubulin. Results are means ± SE of five independent experiments; **P < 0.01 and ***P < 0.001 vs. NT and siCtrl at the same time point, ANOVA followed by Student's t test with Bonferroni correction.

