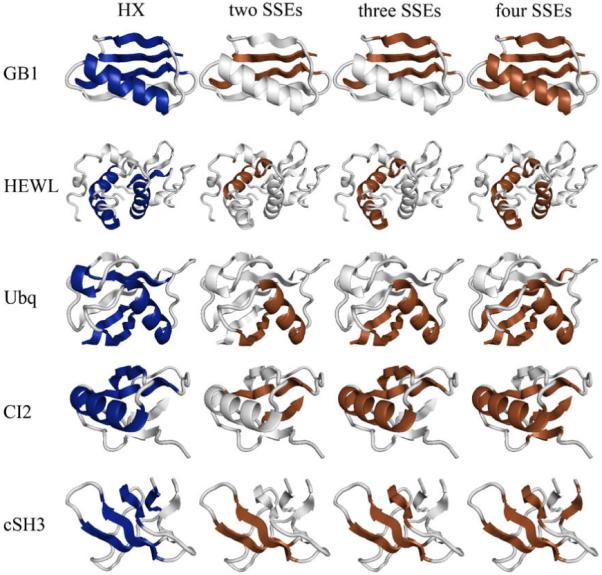
Fig. 1.

Folding cores predicted by HX experiments and the empirical potential function for a few examples (GB1, HEWL, Ubiquitin, CI-2 and cSH3) within the 27-protein test set. Folding core elements are mapped as dark ribbons on the light gray 3D cartoon backbone of the protein structure. Each column represents one of the four methods (HX experiments; two-, three- and four-SSE interaction groups). The cartoons were generated using PyMOL (DeLano Scientific, LLC).
