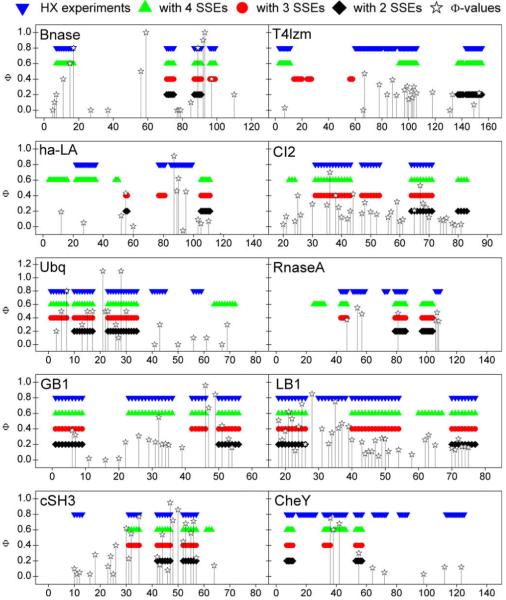
Fig. 3.
Experimental phi values for ten of the 27 test proteins, plotted as functions of residue index. The corresponding protein folding core elements determined by HX experiments and the empirical potential function (from Fig. 2) are provided for reference. The phi values for GB1, CheY, Bnase, CI-2, cSH3 and LB1 were sourced from Garbuzynskiy et al. [50]. The phi values for RnaseA, Ubiquitin, ha-LA and T4 lysozyme were drawn from Font et al. [54], Went and Jackson [52], Saeki et al. [49] and Kato et al. [51], respectively.

