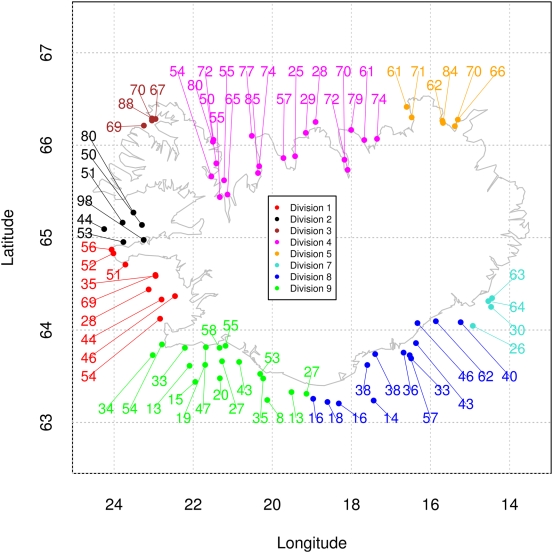
Figure 2. Frequency (percent) of the Pan I A allele in squares within areas.
Areas defined by one degree longitude and one half degree latitude (dotted lines) are each split into four equal sized squares (not shown). Sampling stations within subareas are pooled for frequency estimation. Atlantic cod in Icelandic Marine Research Institute spring spawning surveys in 2005, 2006, and 2007. Color coded divisions based on revised metacod definitions as detailed in paper [19], [61].

