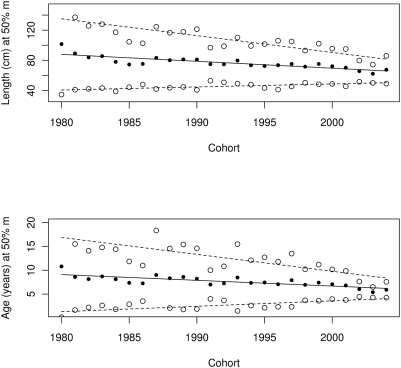
Figure 4. Probabilistic maturation reaction norms: length and age at 50% probability of maturing on cohort.
Solid dots and solid lines represent length or age at 50% probability of maturing. Upper and lower open dots and dashed lines represent length or age at 95 and 5% probability of maturing respectively. Lines are linear regression of length or age on cohort. Based on data on mean length, age and maturity ratio from table 3.1.4 in Anonymous [27] (and see [74]).

