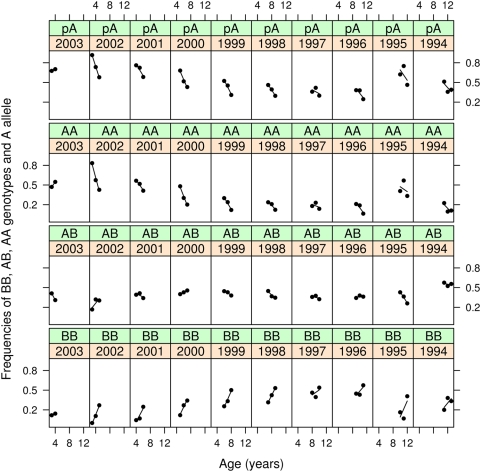
Figure 5. Allelic and genotypic frequencies at age conditioned on year class.
Spring spawning Atlantic cod at Iceland. Frequency of A allele, p A (top panel row), and frequencies of AA, AB, and BB genotypes, fAA, fAB, and fBB (panel rows 2–4 respectively). Panels represent year classes arranged most recent to older from left to right in each row. Points • represent observed frequencies; lines represent linear regression of frequency on age.

