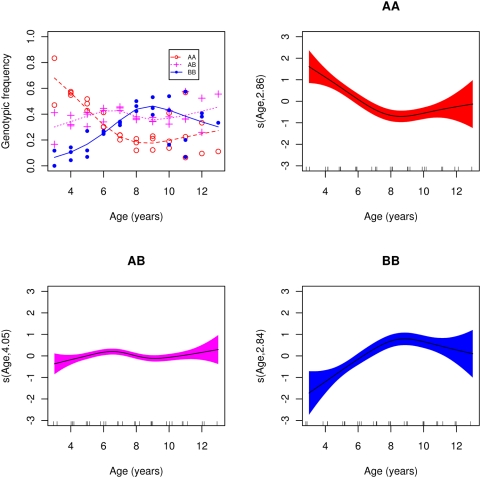
Figure 6. Genotypic frequencies on age in years within year class.
Frequencies of AA genotype (red open circles ○, dashed line), AB (magenta pluses +, dotted line), and BB (blue filled circles •, solid line). Lines represent a generalized additive model (gam) smooth fit with quasibinomial link (panel A). Panels B, C and D: gam smooth fit of genotypic frequency on age within year class for the AA, AB and BB genotypes respectively; shaded region represents two standard errors above and below fit. Smooth carries estimated degrees of freedom.

