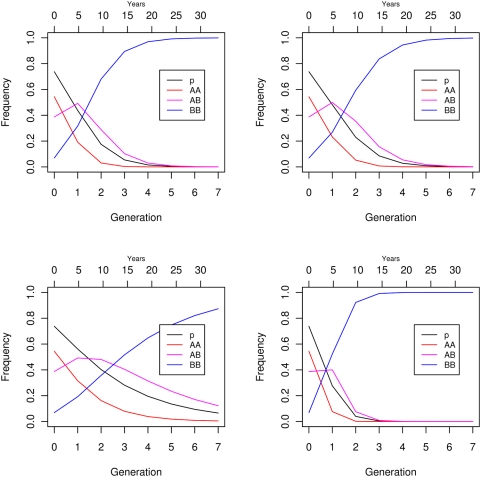
Figure 7. Predicted allele and genotypic frequency changes with a constant-fitness viability model of selection.
Top left panel based on fitness estimates from Table 6; top right panel based on fitness estimates from Supplementary Table S2; lower left panel based on highest fitness estimates from Table 6 (a best case scenario); lower right panel based on lowest fitness estimates from Table 6 (a worst case scenario). Starting frequency of 0.738 assumed based on intercept of gam fit in Figure 6. Years based on a generation time of 4.8 years [36]. Color codes are black for the A allele and red, magenta, and blue for the AA, AB, and BB genotypes respectively.

