Fig. 5.

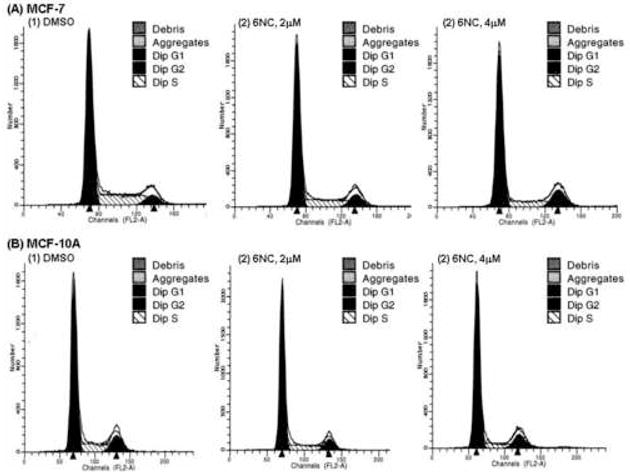
Representative flow cytometry histogram in (A) MCF-7 cells and (B) MCF-10A cells treated with 6-NC (2 and 4 μM) for 24 h. Cells treated with DMSO were used as control.

Representative flow cytometry histogram in (A) MCF-7 cells and (B) MCF-10A cells treated with 6-NC (2 and 4 μM) for 24 h. Cells treated with DMSO were used as control.