
Figure 2.
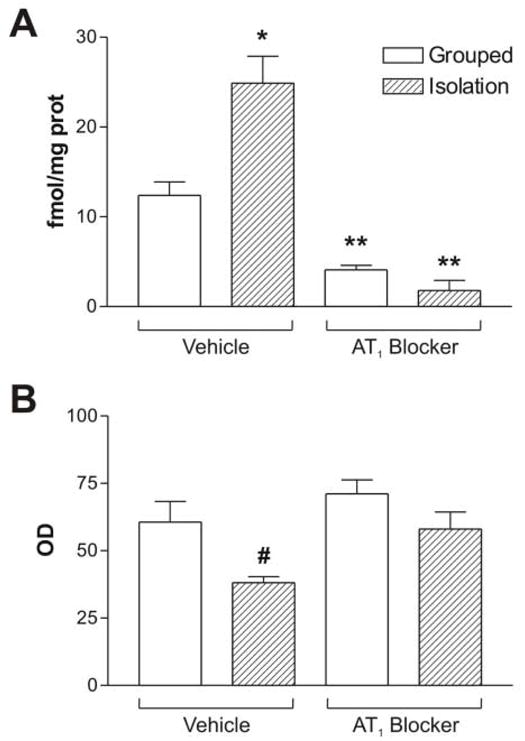
Quantitative autoradiography of AT1 receptor binding (A) and expression of CRF mRNA (B) in the paraventricular nucleus of grouped or isolated animals treated with vehicle or the AT1 blocker. Bars represent means ± S.E.M. of groups of six rats measured individually. * P<0.05 vs. grouped treated with vehicle; ** P<0.01 vs. grouped or isolated rats treated with vehicle; # p<0.05 vs. all others.