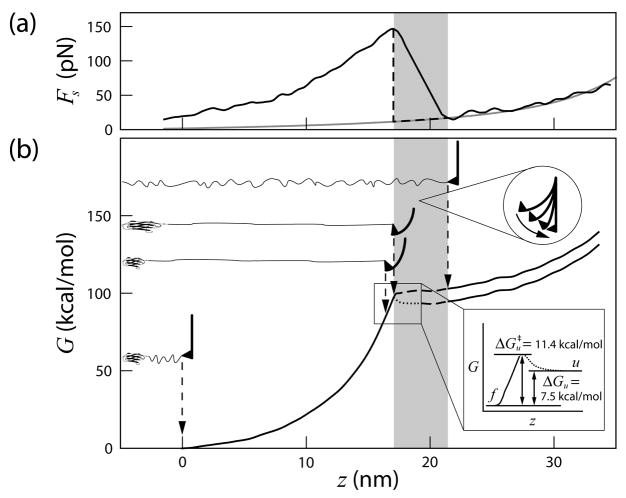
FIG. 3.
Free energy surface of titin I27. (a) A typical force versus extension curve. The gray curve is the WLC fit to the following domain. The shaded region indicates that, when the domain ruptures and the cantilever snaps, the force on the molecule is not registered and, therefore, the free energy surface may not be recovered with high accuracy. The dashed line indicates an approximation of the force exerted on the molecule. (b) The free energy surface of unfolding titin I27. The cantilever position and the molecular extension at each stage are illustrated. The curve is composed of the reconstructed free energy surface up to the transition state (solid) and estimated free energy change [20] and distance [24] beyond the transition state (dotted).

