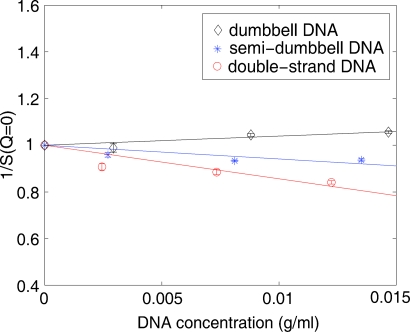
Figure 3.
The inverse of the structure factor S(Q=0) is plotted as a function of DNA concentration (g/ml). A linear fit was performed to derive the second virial coefficient from these data. Dumbbell DNA shows marginal repulsion (A2>0) while weak attraction (A2<0) is observed in semi-dumbbell and ds DNA.

