Abstract
In this letter, we investigate using molecular dynamics simulations the diffusion of water submonolayers on hydrophilic surfaces. In contrast to a strong hydrophilic Ag surface, on a weak hydrophilic Pb surface, the diffusion coefficient is remarkably enhanced at a critical surface coverage and a Λ-shape anomaly with surface coverage is observed, i.e., the diffusion coefficient increases with the increase in surface coverage until a critical surface coverage, beyond which the diffusion coefficient decreases. We explain the anomalous diffusion of water on hydrophilic surfaces by a detailed understanding of molecular cavities and monolayer tail contributing to three-dimensional hydrogen bonding.
Transport of liquid submonolayers on solid substrates has gained significant attention recently because of applications in nanolithography, nanoprinting, wetting∕dewetting of nanopatterned surfaces, etc.1 Diffusion of submonolayer liquids can be markedly different from diffusion of bulk liquids or diffusion of thick (thicknesses of the order of several nanometers) liquid films on surfaces. For example, diffusion of n-alkane and long polyethylene glycol submonolayers exhibits nonmonotonic dependence on the surface coverage, i.e., the surface diffusion increases with increasing surface concentration and then decreases abruptly.2 Even though water is considered to be the most fundamental and basic working fluid, diffusion of water submonolayers on solid substrates has not been investigated so far.
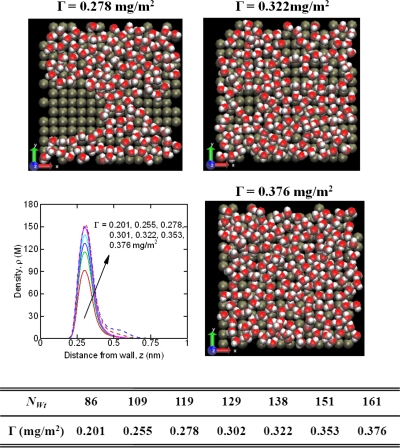
In this letter, we use molecular dynamics simulations to investigate diffusion of water on hydrophilic surfaces when the surface coverage is less than a monolayer—also referred to as incomplete coverage. Two typical hydrophilic surfaces—namely, a Ag surface and a Pb surface—were considered. The Ag surface is considered as a strong hydrophilic surface with (6-12) Lennard-Jones parameters of σAg=0.2544 nm and ϵAg=33.2664 kJ∕mol [ϵAg-OW=4.6508 kJ∕mol, where OW is the oxygen atom inextended simple point charge (SPC∕E)water3] while the Pb surface is considered as a weak hydrophilic surface with σPb=0.3197 nm and ϵPb=22.8067 kJ∕mol.4 For each surface, various surface coverages (denoted by Γ) ranging from Γ=0.201 mg∕m2 to Γ=Γfull=0.376 g∕m2 for Pb surface and Γ=0.201 mg∕m2 to Γ=Γfull=0.393 g∕m2 for Ag surface were considered. The surface coverage is measured as the ratio of the total mass of the water molecules to the surface area. Figure 1 summarizes the various cases considered for Pb surface. For Pb surface, when the surface coverage is smaller than Γ=0.201 mg∕m2, the water layer is separated completely into two parts while for the Ag surface when Γ<0.322 mg∕m2, we hardly see the transport of molecules. From the view point of density, the surface is considered to be fully covered for Γfull=0.376 mg∕m2 for Pb surface and Γfull=0.393 mg∕m2 for Ag surface. Beyond this coverage, a second layer starts to form (see the density plot in Fig. 1).
Figure 1.
Molecular visualization of water submonolayers on the Pb surface and the corresponding density plots. The snapshots were rendered using VMD (Ref. 13). The table summarizes the various surface coverage conditions considered for the Pb surface. NWt is the number of waters in the system.
Simulations were performed using GROMACS 3.2.1 (Ref. 5) in an NVT ensemble. Both Ag and Pb surfaces have fcc structure.6 The surface consists of three layers and the dimensions of each layer are 3.58×3.58 nm2 (xy-plane) for Pb-surface and 3.50×3.50 nm2 for Ag surface. Periodic boundary conditions were assigned along the x and y directions. All the simulations were equilibrated for 2 ns. The sampling period was 22 ns. Water was modeled as SPC∕E model3 and the interatomic interaction between solid atoms was modeled by using the Morse potential.6 The Nosé–Hoover thermostat7 was used to maintain the system temperature at 300 K. The equation of motion was integrated by using the leapfrog algorithm with a time step of 2.0 fs.
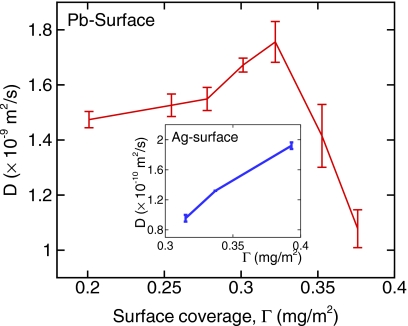
Figure 2 shows the lateral diffusion coefficient of water for various surface coverages. Diffusion perpendicular to the solid surface is negligible (D⊥∼10−12 m2∕s), so we do not investigate it any further in this study. Lateral diffusion coefficient was computed from the mean-squared displacement of water, D=limt→∞[⟨∣Rc.m.(t)−Rc.m.(0)∣2⟩∕4t], where Rc.m. is the (x,y) position of the center of mass of the water molecule. Throughout this letter, diffusion coefficient refers to the lateral diffusion coefficient unless specified otherwise. From Fig. 2, we observe a clear difference between diffusion on strong and weak hydrophilic surfaces. As shown in Fig. 2 inset, for the strong hydrophilic Ag surface, water molecules are significantly immobilized (D<10−11 m2∕s, data not shown in the figure) when Γ is less than 0.322 mg∕m2 because the water-surface interaction (ϵAg-OW=4.6508 kJ∕mol) is significantly stronger compared to the water-water interaction (ϵOW-OW=0.6502 kJ∕mol). The maximum diffusion coefficient is found to be 1.92 (±0.045)×10−10 m2∕s at Γ=Γfull=0.393 mg∕m2. In contrast to the Ag surface, for the weak hydrophilic Pb surface we observe considerable diffusion with anomalous Λ behavior: the diffusion coefficient gradually increases with the decrease in surface coverage until it reaches a critical surface coverage (Γcrit=0.322 mg∕m2) and then starts to decrease with a further decrease in the surface coverage (this is referred to as Λ shape2). The maximum diffusion coefficient at Γ=Γcrit is 1.76 (±0.074)×10−9 m2∕s, which is about 1.7 times larger than the value of D=1.08 (±0.069)×10−9 m2∕s at Γ=Γfull. Since the Pb surface has a much smaller ϵPb, diffusion becomes substantial and the interplay between water-water and water-surface interactions becomes important. If the diffusion is governed by water-surface interactions, the water-surface interaction energy should exhibit a similar trend to that of the diffusion. However, the surface-water interaction energy is found to be around −14 kJ∕mol regardless of the surface coverage, which indicates that the anomalous diffusion of water on the weak hydrophilic Pb surface is primarily due to the water-water interactions while the solid surface just holds the water molecules on the surface steadily. As diffusion of water on Ag surface is insignificant, in the discussion to follow, we will focus on the weak hydrophilic Pb surface to understand the diffusion mechanism as a function of surface coverage. Hereafter, surface refers to the Pb surface unless noted otherwise.
Figure 2.
Diffusion coefficient of water on Pb and Ag surfaces for various surface coverages.
As shown in Fig. 1, the water submonolayer has a number of depletion zones (empty regions on the surface). The depletion zones were identified by using the Hoshen–Kopelman percolation algorithm8 and then the number and size distributions were computed. Considering that the molecular transport in dense fluids proceeds primarily by a large number of small jumps whose lengths are approximately equal to the intermolecular spacing rather than a few large ones,9 we used 2.77 times the size of a water molecule (dH2O=0.2785 nm) as the criterion, vcrit, to differentiate between small (favorable for diffusion) and large (not very favorable for diffusion) depletion zones. If the size of the depletion zone, v, is smaller than vcrit, the depletion zone is referred to as molecular cavity and if the size is larger than vcrit, it is referred to as macroscopic void. Typically, more than 95% of the depletion zones are molecular cavities while only less than 5% are macroscopic voids.
Figure 3a shows the variation of the average size of the molecular cavity as a function of surface coverage Γ. For a given surface coverage, the average size of the molecular cavity is computed using the expression
| (1) |
where is the size distribution function of molecular cavities. Figure 3b shows the variation of the average number of molecular cavities per water molecule as a function of Γ. The average number of molecular cavities per water molecule is defined as
| (2) |
where NWt(Γ) is the number of water molecules which is a function of Γ, N is the number of molecular cavities, and is the number distribution function of molecular cavities. Both the average size and number of molecular cavities per water molecule have their maxima at Γcrit=0.322 mg∕m2, which confirms that molecular cavities play an important role in diffusion. Furthermore, in Fig. 3c we normalized the molecular free volume, , by the number of water molecules in the system, NWt(Γ), as . We found that captures the features of diffusion (shown in Fig. 2) better than or alone. Given this observation, we can assume a simple relation between the diffusion coefficient and the normalized molecular free volume:
| (3) |
Equation 3 is quite similar to the corrected Enskog diffusion formula for a bulk hard-sphere liquid,10 which also expresses that the diffusion coefficient is proportional to the molecular free volume and inversely proportional to the number of molecules.
Figure 3.
Statistics of molecular cavities for various surface coverages: (a) average size of molecular cavity; (b) average number of molecular cavities per water molecule; (c) normalized molecular free volume.
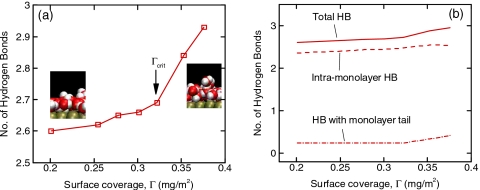
We also examined the hydrogen bonding (HB) characteristics to further understand the diffusion phenomena. HB was defined using a geomeric criterion.11 Figure 4a shows the number of hydrogen bonds (nHB) for various surface coverages. A significant increase in nHB is observed after Γcrit=0.322 mg∕m2, where we can see the formation of the monolayer tail while the second layer has not been formed yet (see Fig. 1). When the tail is formed, as seen from the molecular visualizations in the inset of Fig. 4a, the chance for a molecule to go on top of another molecule increases, whereas in the case of low surface coverage most molecules just stay in the monolayer. In order to investigate the influence of the tail region on HB, we further divided the monolayer into primary (z<0.4 nm; ρ>30 M in Fig. 1) and tail (z>0.4 nm; ρ<30 M in Fig. 1) regions. In Fig. 4b, we computed the contribution to nHB from intramonolayer HB (two-dimensional HB) and from monolayer tail (three-dimensional HB). The contribution from the tail region increases significantly beyond Γcrit while it does not change for Γ<Γcrit. This implies that the tail region, even though it looks trivial in the density plot, adds three-dimensional HB features and makes the entire HB network more rigid and causes lower diffusion.
Figure 4.
(a) Number of HBs per water molecule for various surface coverages; (b) contributions from intramonolayer HB and the HB with monolayer tail on the total HB.
To conclude, the lateral diffusion of water on a weak hydrophilic surface exhibits a Λ-shape anomaly. This is in contrast to the critical slowing of water diffusion (V shape) observed in carbon nanotubes.12 The anomalous behavior can be explained by the normalized molecular free volume. The significant increase in three-dimensional HB from the tail region of the monolayer also contributes to the lower diffusion near full surface coverage.
Acknowledgments
This research was supported by NSF under Grant Nos. 0120978, 0325344, 0328162, and 0523435 and by NIH under Grant No. PHS 2 PN2 EY016570B.
References
- Salaita K., Wang Y., and Mirkin C. A., Nat. Nanotechnol. 10.1038/nnano.2007.39 2, 145 (2007); [DOI] [PubMed] [Google Scholar]; Kraus T., Malaquin L., Schmid H., Riess W., Spencer N. D., and Wolf H., Nat. Nanotechnol. 10.1038/nnano.2007.262 2, 570 (2007); [DOI] [PubMed] [Google Scholar]; Wang J. Z., Zheng Z. H., Li H. W., Huck W. T. S., and Sirringhaus H., Nature Mater. 10.1038/nmat1073 3, 171 (2004). [DOI] [PubMed] [Google Scholar]
- Park J. H. and Aluru N. R., Chem. Phys. Lett. 447, 310 (2007); [Google Scholar]; Zhao J. and Granick S., J. Am. Chem. Soc. 10.1021/ja0493749 126, 6242 (2004). [DOI] [PubMed] [Google Scholar]
- Berendsen H. J. C., Grigera J. R., and Staatsma T. P., J. Phys. Chem. 10.1021/j100308a038 91, 6269 (1987). [DOI] [Google Scholar]
- Haliciouğlu T. and Pound G. M., Phys. Status Solidi A 10.1002/pssa.2210300223 30, 619 (1975). [DOI] [Google Scholar]
- Lindahl E., Hess B., and van der Spoel D., J. Mol. Model. 7, 306 (2001). [Google Scholar]
- Pamuk H. Ö. and Haliciouğlu T., Phys. Status Solidi A 37, 695 (1976). [Google Scholar]
- Nosé S., Mol. Phys. 10.1080/00268978400101201 52, 255 (1984). [DOI] [Google Scholar]
- Hoshen J. and Kopelman R., Phys. Rev. B 10.1103/PhysRevB.14.3438 14, 3438 (1976). [DOI] [Google Scholar]
- Alder B. J. and Einwohner T., J. Chem. Phys. 10.1063/1.1726408 43, 3399 (1965). [DOI] [Google Scholar]
- Dymond J. H., J. Chem. Phys. 10.1063/1.1681175 60, 969 (1974). [DOI] [Google Scholar]
- Luzar A. and Chandler D., Nature (London) 10.1038/379055a0 379, 55 (1996). [DOI] [Google Scholar]
- Mashl R. J., Joseph S., Aluru N. R., and Jakobsson E., Nano Lett. 10.1021/nl0340226 3, 589 (2003). [DOI] [Google Scholar]
- Humphrey W., Dalke A., and Schulten K., J. Mol. Graphics 10.1016/0263-7855(96)00018-5 14, 33 (1996). [DOI] [PubMed] [Google Scholar]


