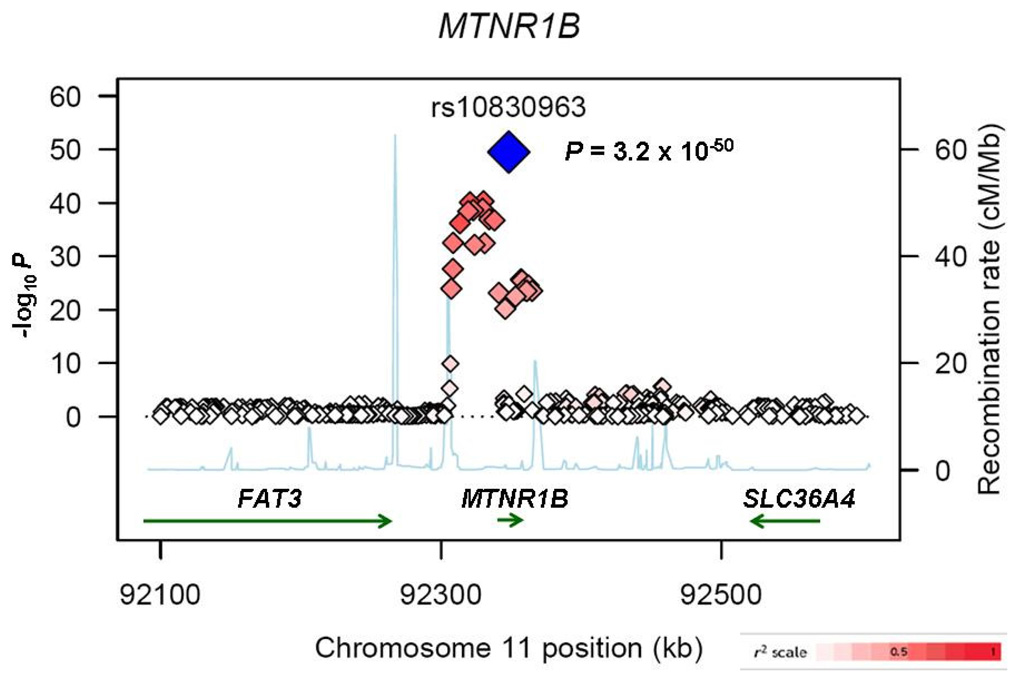
Figure 1. Regional plot of fasting glucose association results for the MTNR1B locus across 10 MAGIC GWAS.
Meta-analysis -log10 P-values are plotted as a function of genomic position (NCBI Build 35). The SNP with the strongest signal (rs10830963) is denoted by a blue diamond. Estimated recombination rates (from HapMap) are plotted to reflect the local linkage disequilibrium structure around associated SNPs and proxies (according to a white-to-red scale from r2=0 to r2=1; based on pair-wise r2 values from HapMap CEU). Gene annotations were taken from the University of California-Santa Cruz genome browser.

