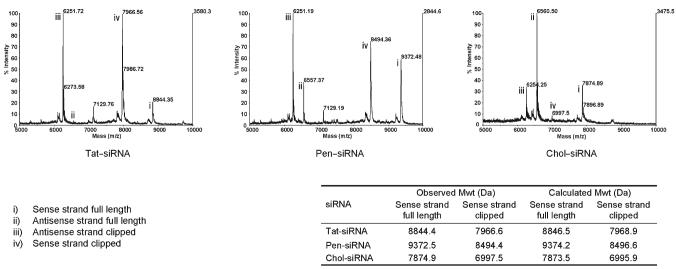
Fig. 3.
MALDI-TOF mass spectra of Tat–, Penetratin– and cholesterol–siRNA conjugates (100 μM) after 3 h incubation with 10% mouse serum at room temperature using matrix a. Spectra show the same mass difference between parent and clipped species (refer to the table), and therefore the same clips as capped siRNA (see Fig. 2).

