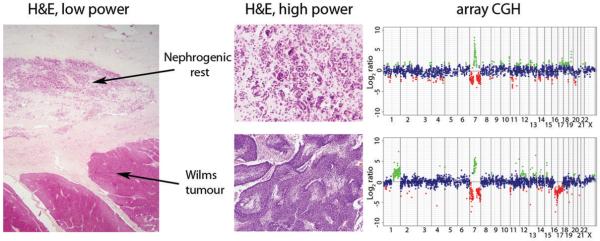
Figure 1. Array CGH of a nephrogenic rest and Wilms tumour from the same patient harbouring high level gain of 7q21.
Haematoxylin and eosin stained sections (low power, original magnification ×12.5; high power, original magnification ×200) from a perilobar nephrogenic rest and associated blastemal type Wilms tumour alongside copy number profile by array CGH. Both lesions harbour a complex rearrangement on chromosome 7 leading to gain of 7q21 and concurrent loss of 7p and 7q22-qter. Additional alterations including gain of 1q and loss of 16q are present in the Wilms tumour. Genome plots show log2 ratios for each clone (x axis) plotted according to chromosomal location (y axis). The centromere is represented by a horizontal line. Points are coloured green and red to represent gains and losses, respectively.

