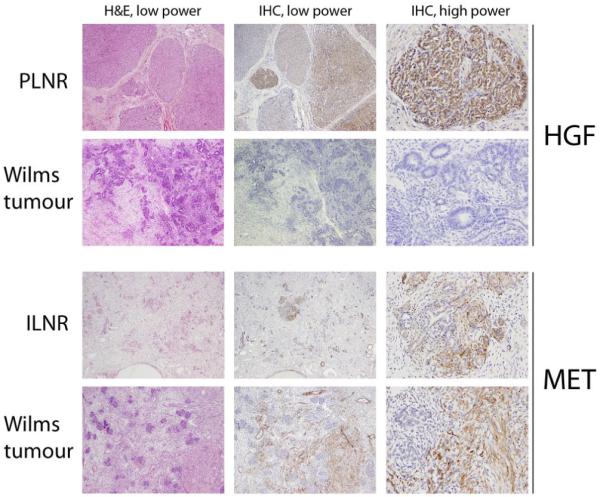
Figure 2. Expression of HGF and Met in whole sections of nephrogenic rests and Wilms tumours.

Photomicrographs demonstrating typical patterns of HGF and Met expression by immunohistochemistry in distinct nephrogenic rests and Wilms tumours from different patient samples. First row, a perilobar nephrogenic rest (PLNR) with strong, diffuse HGF staining in blastemal cells. Second row, a Wilms tumour demonstrating no immunoreactivity. Third row, an intralobar nephrogenic rest (ILNR) with strong Met expression in the stromal compartment. Fourth row, a Wilms tumour with strong stromal immunoreactivity. Low power, original magnification ×200; high power, original magnification ×400.
