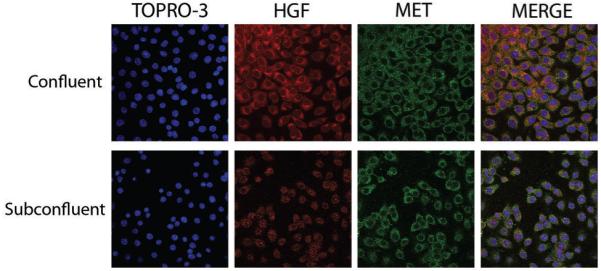
Figure 4. Expression of HGF and Met in M15 cells with epithelial and mesenchymal phenotypes.

M15 cells grown at confluence and subconfluence stained by immunofluorescence for HGF (red, cytoplasm) and Met (green, cell membrane). Consistent staining is observed for Met, whilst an upregulation of HGF is seen in confluent conditions. Nuclei were counterstained with TOPRO-3. Merge indicates an integrated image of all three channels.
