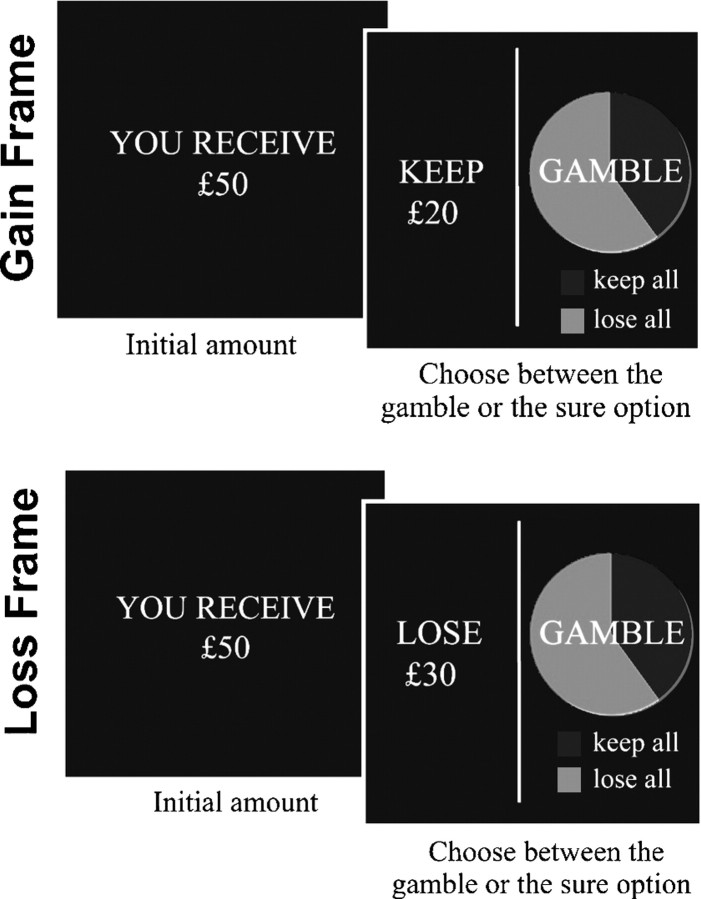
Figure 1.
Task. Participants were shown a message indicating the amount of money received to play in that trial (e.g., “you receive £50”). Subjects then had to choose between a “sure” or a “gamble” option presented in the context of two different “frames.” The “sure” option was formulated as either the amount of money retained from the initial starting amount (e.g., keep £20 of a total of £50-gain frame) or as the amount of money lost from the initial amount (e.g., lose £30 of a total of £50-loss frame). The “gamble” option was identical in both frames and represented as a pie chart depicting the probability of winning or losing.

