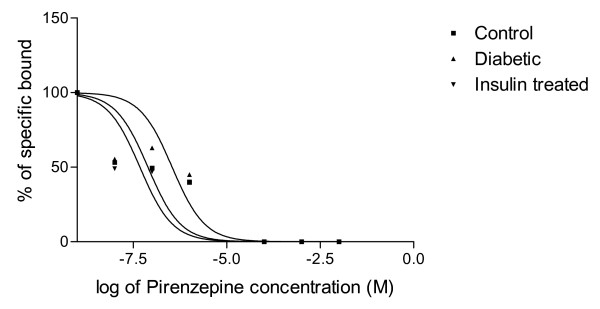
Figure 4.
Representative graph showing displacement analysis of [3H]QNB binding against pirenzepine in the corpus striatum of Control, Diabetic and Diabetic+Insulin treated group rats. Control (black circle), Diabetic (upward pointing black triangle), Insulin treated diabetic rats (downward pointing black triangle). Competition studies were carried out with 1 nM [3H]QNB in each tube with pirenzepine concentrations varying from 10-9 to 10-4 M. Data were fitted with iterative nonlinear regression software (Prism, GraphPad, San Diego, CA). Ki – The affinity of the receptor for the competing drug. EC50 is the concentration of the competitor that competes for half the specific binding.

