FIGURE 3.
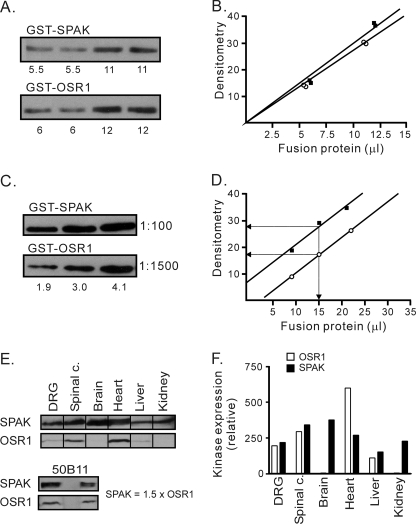
Calibration of SPAK and OSR1 antibodies and quantitation of SPAK and OSR1 protein abundance in tissues. A, Western blot shows GST-SPAK and GST-OSR1 at two different amounts, probed with anti-GST antibody (1:1000). B, densitometry analysis shows equivalent signals for both full-length proteins (10.2 μl of GST-SPAK elicits the same signal intensity than 10 μl of GST-OSR1). C, quantitation of anti-SPAK and anti-OSR1 antibodies. The same amounts of GST-SPAK and GST-OSR1 were loaded and run in a gel at three different concentrations, transferred, and immunoblotted with anti-SPAK (1:100) and anti-OSR1 (1:1500) antibodies, respectively. D, densitometry analysis shows that anti-SPAK at 1:100 dilution yields a signal 1.7 times stronger than anti-OSR1 at 1:1500 dilution. E and F, Western blot analysis of SPAK and OSR1 expression in DRG, spinal cord, brain cortex, heart, kidney, liver, and 50B11 cells. Equal amount of total protein (200 μg) was loaded per lane. Primary antibodies were used at dilutions of 1:100 for SPAK and 1:1500 for OSR1 to quantitate the level of expression. Densitometry analysis demonstrates that OSR1 and SPAK have similar expression levels in DRG, spinal cord, and liver. Note that, in brain and kidney, there is very little OSR1 expression, whereas in heart, OSR1 expression was twice that of SPAK. SPAK expression in 50B11 cells was shown to be 1.5 times higher than OSR1 expression.

