FIGURE 6.
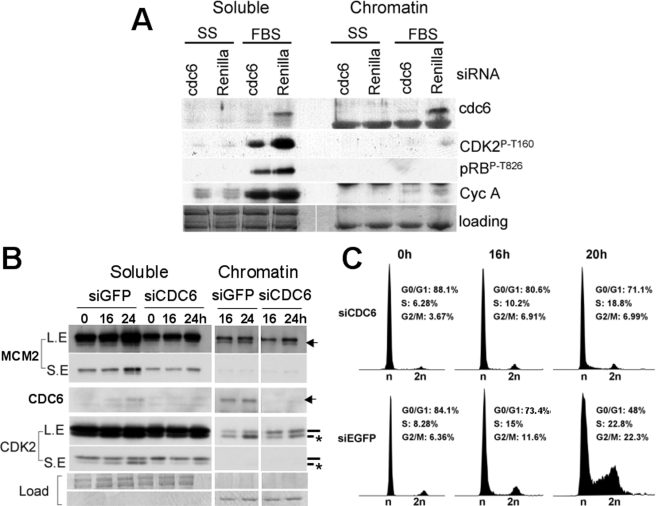
CDC6 expression is coupled to phosphorylation of CDK2 on Thr-160 and exit from quiescence induced by serum. A, BJ-hTERT cells were transfected with siRNAs targeting CDC6 or renilla luciferase in conditions of serum starvation. Forty-eight hours later, cells were restimulated with 10% FBS, and 48 h after restimulation, cells were harvested and lysed for soluble/chromatin-bound protein fractionation and Western blot analysis. B and C, BJ-hTERT cells were transfected with siRNAs targeting CDC6 or EGFP in conditions of serum starvation. Seventy-two hours later, cells were re-stimulated with FBS and harvested at the indicated time points. Cell pellets were divided in two for soluble/chromatin-bound protein fractionation and Western blot analysis (B) and PI/FACS analysis (C). A and B, same exposure times are shown for both fractions. B, CDK2 band corresponding to phosphorylated Thr-160 is indicated with an asterisk. LE indicates long exposure. SE indicates short exposure. C, percent of cells in each cell cycle phase is indicated.

