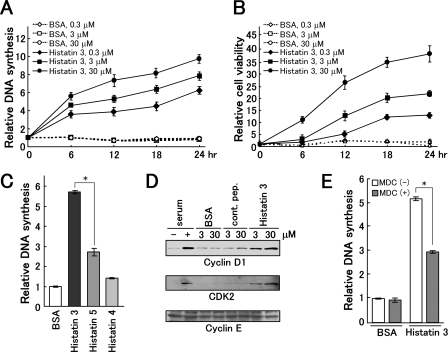
FIGURE 4.
Effect of histatin 3 on DNA synthesis and cell survival. A and B, DNA synthesis and cell survival induced by histatin 3. After HGFs had been cultured in DMEM containing 0.1% FBS over 24 h, histatin 3 and BSA (control) were added to cells at the concentrations indicated, and cells were cultured for the indicated time periods. DNA synthesis in cells and cell viability were determined by measuring BrdUrd incorporation using the Frontier BrdU Cell Proliferation Assay kit and by an MTT assay, respectively. Each data point is the mean of duplicated samples with error bars showing standard deviations. C, DNA synthesis in the presence of histatins 4 and 5. Histatins and BSA at 0.3 μm were added to HGFs, and DNA synthesis was analyzed as described in A and B. Bars represent the means of duplicated samples with error bars showing standard deviations. *, p < 0.01 (Student's t test). D, examination of expression patterns for cyclin D1, cyclin E, and CDK2. HGFs were cultured in DMEM containing 0.1% FBS over 24 h. Cells were then stimulated with serum, BSA, control peptide (cont. pep.), and histatin 3 for 8 h. Expression levels of cyclin D1, cyclin E, and CDK2 were examined by Western blotting with the respective antibodies. E, DNA synthesis in cells after the addition of 0.3 μm histatin 3 with or without MDC. DNA synthesis was examined as described under “Experimental Procedures.” Bars represent the means of duplicated samples with error bars showing standard deviations. *, p < 0.01 (Student's t test).

