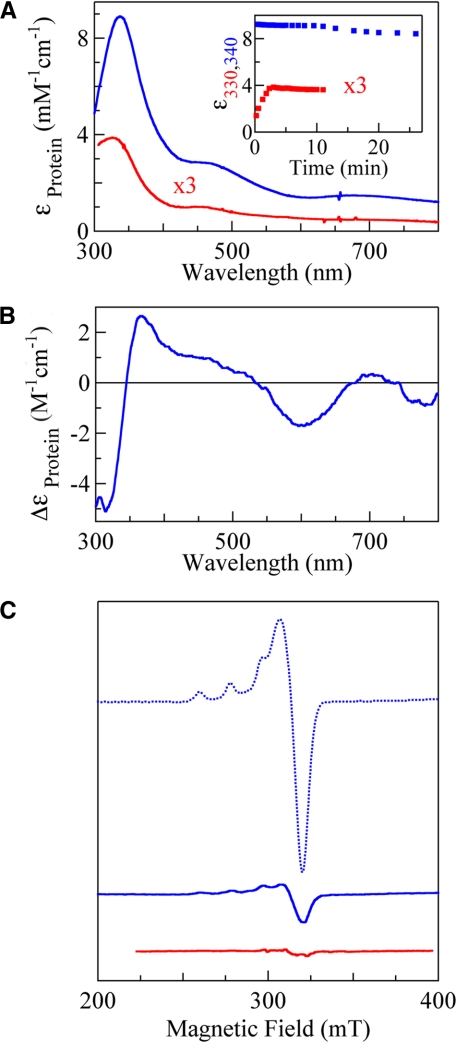
FIGURE 4.
Absorption (A), CD (B), and EPR (C) spectra of intermediate I derived from C500S (blue) and C500S/D112N (red). A, inset, the absorbance decay of intermediate I at 340 and 330 nm formed from C500S and C500S/D112N, respectively. Sample conditions for measurements of absorption and CD spectra are the same as those in Fig. 3 except that a 0.5-cm path length cell was used for ∼100–200 μm proteins. EPR spectra were measured at 3.5 K, with a frequency of 9.0 GHz, microwave power of 1 milliwatt, modulation of 1 mT at 100 kHz, filter of 0.3 s, sweep time of 4 or 8 min, and amplitude of 400. The spectrum of C500S before the reaction (dotted blue line) is also shown for comparison.

