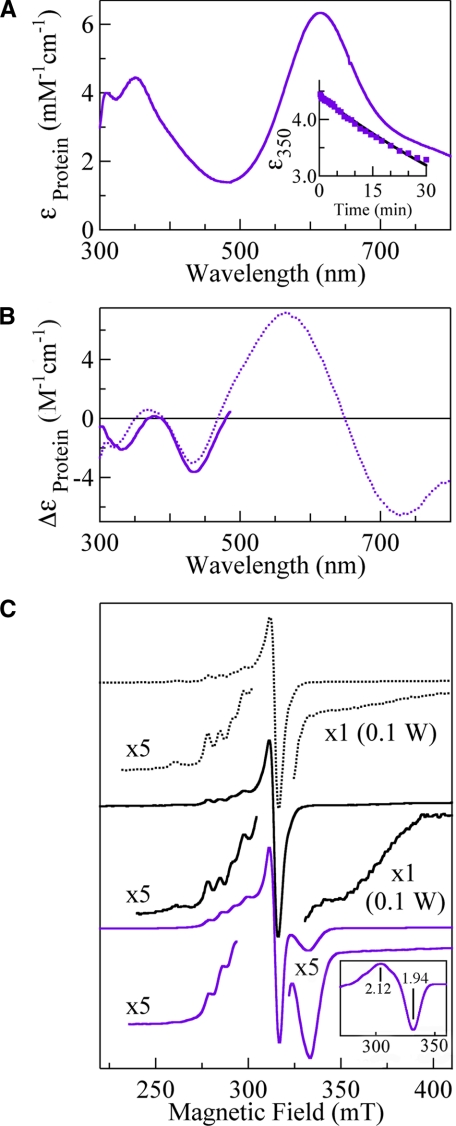
FIGURE 5.
Absorption (A), CD (B), and EPR (C) spectra of intermediate II derived from rCueO (black) and E506Q (purple). The absorption spectrum of intermediate II formed from E506Q (A) was obtained from supplemental Fig. 1B. Sample conditions are the same as those for Fig. 3. A, inset, the absorbance decay of intermediate II at 350 nm. The measurement of the CD spectrum at <500 nm (B) was accomplished within 5 min after starting the reaction to avoid the masking effect due to the oxidized type I copper. C, the EPR spectrum of rCueO (dotted black line) and the spectra obtained soon after the reactions of rCueO (black) and E506Q (purple) at 3.5 K, with a frequency of 9.0 GHz, microwave power of 1–100 or 200 milliwatts, modulation of 1 mT at 100 kHz, filter of 0.3 s, sweep time of 4 or 8 min, and amplitude of 400–2,000. C, inset, the overall EPR signal of intermediate II, which was obtained by subtracting the type I copper signal.

