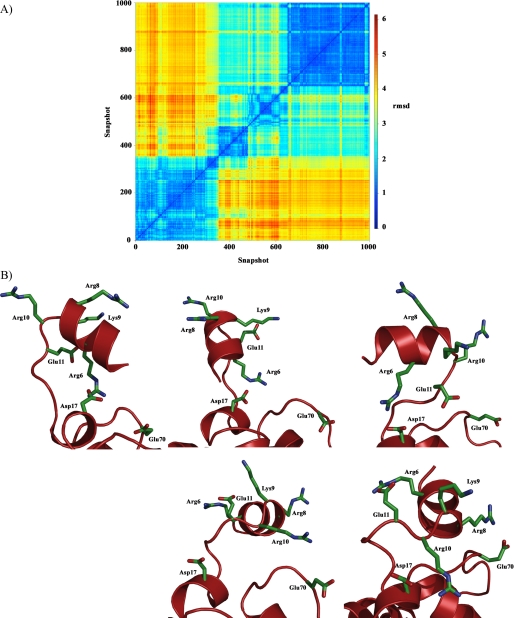
FIGURE 7.
Structural flexibility of the Pre-A region in M. tuberculosis HbN. A, plot of cross-r.m.s.d. (Å) determined for backbone atoms between snapshots (taken every 100 ps) collected along the 100-ns trajectory for the M. tuberculosis HbN (cross-r.m.s.d. values were computed using the ptraj module of AMBER and plotted using R software). B, arrangement of charged residues in Pre-A region found in (top left) the x-ray crystallographic structure 1idr and four representative snapshots taken as the closest members to the centroid of the structural clusters depicted above (ordered from left to right and top to bottom; see also Fig. supplemental S4).

