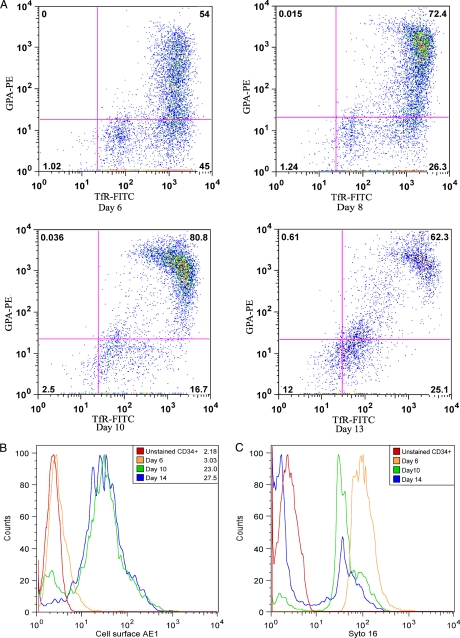
FIGURE 1.
Flow cytometry analysis and AE1 expression in differentiating CD34+ erythroid progenitors. A, representative flow cytometry analysis used to monitor differentiation of CD34+ cells using cell-surface markers TfR and GPA. Numbers indicate the percent of positive cells in each quadrant. B, histogram of the increase in AE1 expression in differentiating CD34+ cells as measured by flow cytometry. Geometric mean fluorescence intensities are shown. C, histogram of the loss of DNA by SYTO16 dye binding in differentiating CD34+ cells as measured by flow cytometry.

