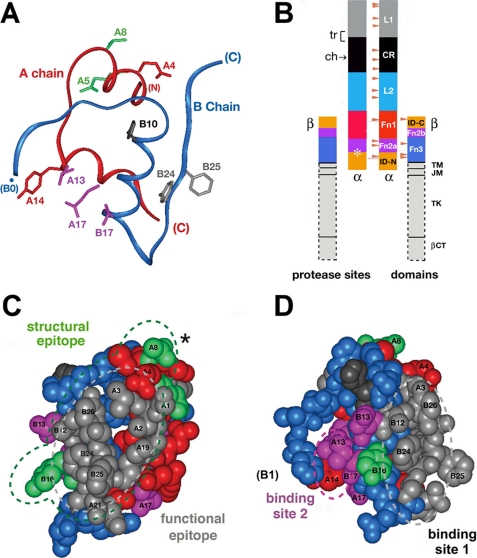
FIGURE 1.
Structure of insulin and domain organization of the insulin receptor. A, ribbon model of insulin (as T-state protomer; Protein Data Bank code 4INS) with the A-chain in red and the B-chain in blue. Selected side chains are shown: GluA4 and TyrA14 (red); GlnA5 and ThrA8 (green); LeuA13, LeuA17, and ValB17 (magenta); HisB10 (black); and PheB24 and PheB25 (gray). B, domain organization of the IR as an (αβ)2-dimer. Color-coded segments indicate structural domains; at left are selected sites of limited proteolysis of photocross-linked complexes: trypsin (tr, bracket at the L1-CR domain junction) and chymotrypsin (ch, arrow within the CR domain), and tryptic and chymotryptic sites at the Fn2a-ID-N junction (asterisk). Beige arrowheads indicate sites of N-linked glycosylation in the extracellular portion of the IR. This figure was adapted from Ref. 5 with the permission of the authors. Dashed lines outline domains (light gray) not present in the crystal structure of the IR ectodomain (Fig. 7); these span the transmembrane α-helix (TM), the juxtamembrane segment (JM), tyrosine kinase (TK), and the C-terminal tail of the β-subunit (βCT). C, space-filling model of the insulin protomer (with residues B27-B30 removed) showing the functional epitope (gray) and its extended structural epitope (green). D, view of the insulin protomer rotated by 90° about the vertical axis with classification of binding sites 1 (gray) and 2 (magenta) as proposed by De Meyts (18, 73). Residues B27-B30 were deleted from the coordinate file to enable better visualization of IleA2 and ValA3 in accord with the detachment model (preceding article (31)).

