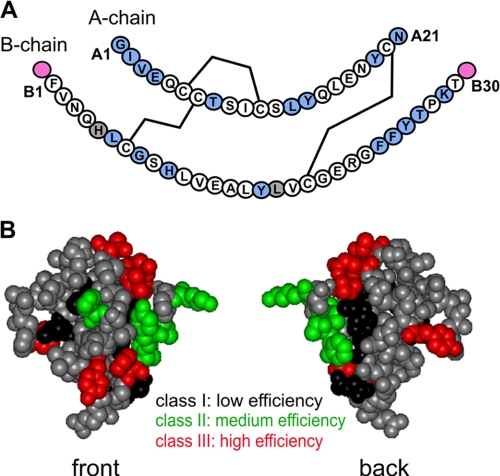
FIGURE 2.
Sites of photoprobes in insulin and summary of cross-linking efficiencies. A, sequence of human insulin showing the A-chain (upper) and B-chain (lower); in each case, the N-terminal residue is at left, and C-terminal residue is at right. The three disulfide bridges (cysteines A6-A11, A7-B7, and A20-B19) are shown as black lines. Sites of Pmp derivatives are highlighted in light blue (within A- or B-chains) or magenta (B-chain extensions B0 and B31). Gray shading (residues B5 and B17) indicates failed syntheses due to impaired chain combination. The PmpB8 analog contained the d-isomer; both l- and d-Pmp derivatives were individually prepared at positions A1 and B24. Not shown are DKP substitutions in the B-chain to yield a monomeric template (AspB10, LysB28, and ProB29) and biotin tags at possible attachment sites (B0, B1, A1, or via the ε-NH2 moiety of a d-LysA1 substituent; see “Experimental Procedures” and supplemental Table S1). B, front and back surfaces of insulin color-coded by efficiency of photocross-linking. The front surface is predominantly composed of B-chain residues, and the back surface of A-chain residues. Sites of high, medium, and low photocross-linking efficiency are shown in red, green, and black, respectively; sites not tested are shown in gray. The structure shown is based on a T6 crystallographic protomer (2Zn molecule 1; Protein Data Bank code 4INS).

