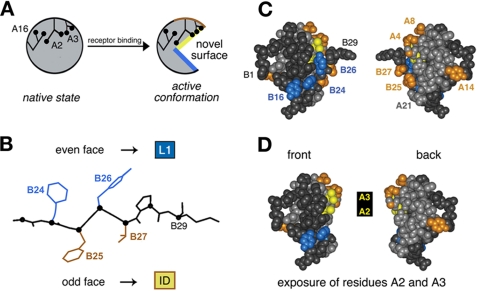
FIGURE 6.
Mapping of photo contacts and relationship to induced fit. A, schematic model of insulin fit. The insulin monomer is proposed to undergo a change in conformation from its closed unbound state (left) to a more open state (right) in which detachment of the C-terminal B-chain β-strand (residues B24-B28) exposes conserved aliphatic side chains IleA2 and ValA3. B, alternating pattern of photo contacts by the C-terminal B-chain β-strand in which its even-numbered face (PheB24 and TyrB26) contacts the L1 domain of the IR (α-subunit residues 1-158), whereas the odd-numbered face (PheB25 and ThrB27) contacts the C-terminal insert domain (ID)-derived tail of the α-subunit. C, space-filling model of insulin depicting its front and back surfaces (left and right). Putative L1 contact residues TyrB16, PheB24, and TyrB26 are shown in blue, and insert domain contact residues (GlyA1, IleA2, ValA3, GluA4, ThrA8, TyrA14, PheB25, and ThrB27) are shown in yellow (A2 and A3) or gold. The A-chain is otherwise shown in light gray, and the B-chain in dark gray. D, corresponding molecular surfaces following removal of residues B26-B30 to simulate exposure of IleA2 and ValA3 upon detachment of the C-terminal B-chain β-strand in the hormone-receptor complex. The color code is the same as described for C.

