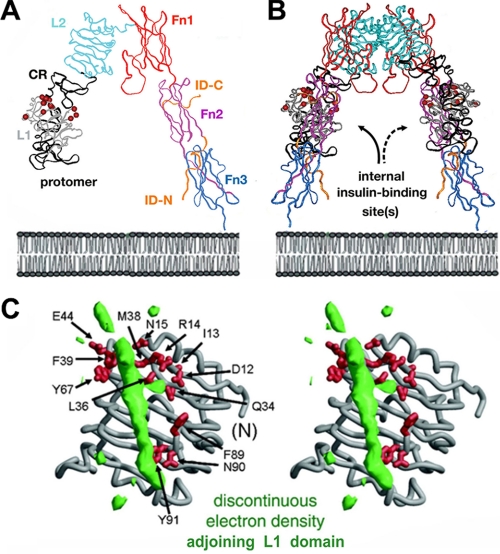
FIGURE 7.
Structure of the IR ectodomain and possible proximity of L1 and ID-N. A, ribbon model of the component protomer (Protein Data Bank code 2DTG). Individual domains L1, CR, L2, Fn1, Fn2, and Fn3 are shown in gray, black, light blue, red, purple, and dark blue, respectively. The insert domain (ID) exhibits missing or discontinuous electron density (residues 655-755; IR isoform A); only respective N- and C-terminal subsegments of ID-N and ID-C are well defined (orange). The color code is in accord with the schematic model in Fig. 1B. B, inverted V-shaped dimer. The position of the plasma membrane is indicated at the bottom in a schematic lipid bilayer. C, stereo model showing the L1 domain (gray ribbon) in relation to unassigned and discontinuous electron density (green), potentially from αCT; density may represent ∼20 residues of the insert domain. αCT- and ID-N-related density may reorganize upon insulin binding. Residues in L1 critical to hormone binding (as inferred from Ala scanning mutagenesis) (62) are shown as red sticks. C was kindly provided by C. Ward.

