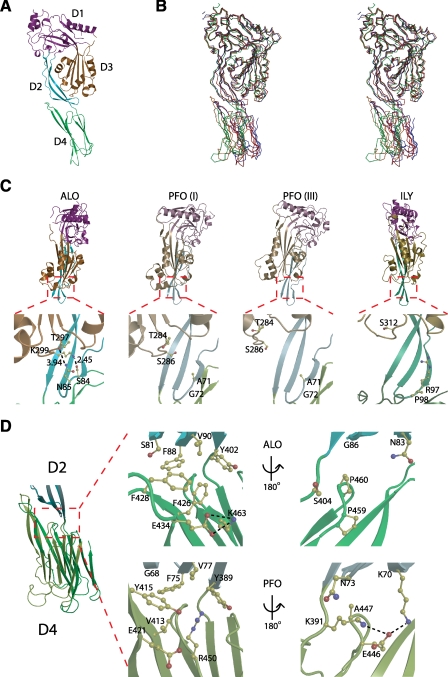
FIGURE 3.
Structural comparison of ALO with PFO (crystal form I), PFO (crystal form III), and ILY. A, side view of ALO colored by domain. D1 is colored magenta, D2 is colored cyan, D3 is colored orange, and D4 is colored green. B, stereo view of ALO aligned with PFO (I), PFO (III), and ILY using LSQ superimposition in COOT on all Cα′ atoms in D1 and D3 (70). ALO is colored red, PFO (I) is colored orange, PFO (III) is colored blue, and ILY is colored green. C, front view of ALO, PFO (I), PFO (III), and ILY aligned by D2. D4 has been omitted for clarity. Lower panels highlight the interactions or lack there of between the β-turn of D2 and transmembrane hairpin 2 of D3. D, side view of ALO and PFO (I) aligned by D2. The center panels show a close-up of the hydrophobic networks at the D2-D4 interface. The right panels show the interactions on the flip side of the D2-D4 interface.

