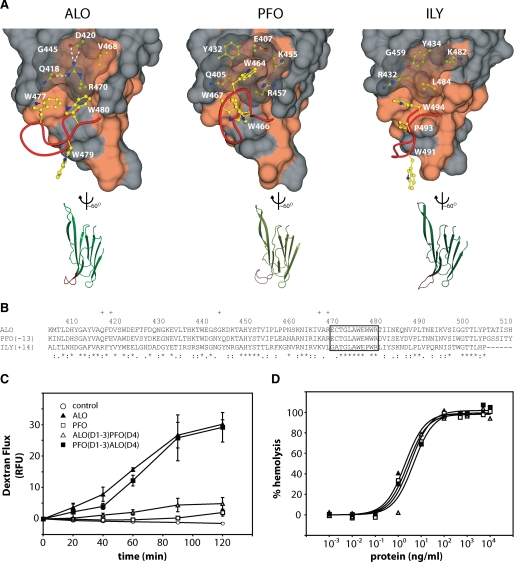
FIGURE 5.
Structural comparison of domain 4 and functional results from domain swap experiments. A, on the top are surface representations of D4. The red ribbon represents the main chain of the highly conserved undecapeptide region. The Trp side chains of the undecapeptide region are shown in yellow. The side chains under the translucent surface are thought to play a role in the orientation of the Trp side chains. Hydrophobic surfaces are colored coral. On the bottom are representations of D4 aligned with each other. The undecapeptide region is again highlighted in red. B, sequence alignment of D4s using ClustalW. Plus signs, residues not in the undecapeptide that are displayed in A. Asterisks, identical residues. Colons, conserved substitutions. Periods, semiconserved substitutions. C, 3-kDa dextran-fluorescein flux in C2BBE monolayers treated apically at 10 μg/ml. D, hemolysis of human erythrocytes after a 30-min treatment. RFU, relative fluorescence units.

