
Fig. 1.
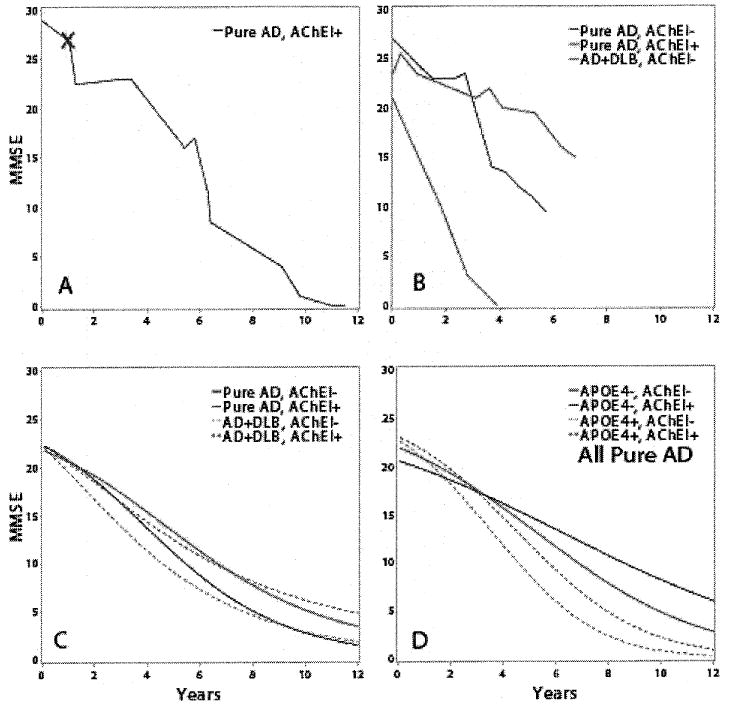
The change of MMSE scores over time is depicted as raw data from dementia patients (A–B), or as statistically rendered group data that allows between-cohort comparisons (C–D). A) MMSE scores from a representative patient (female, no history of AChEI use) with AD pathology at autopsy. Red ‘X’ is time of diagnosis. B) Three traces show representative examples of separate female ApoE-matched individual patients with AD (no AChEI; black); AD (with AChEI; red); and AD + DLB (no AChEI; green). C) Groups of patients with AD (n = 45) and AD + DLB (n = 20) are compared using statistical rendering; the AD + DLB patients decline faster (p < 0.01 for asymptote and midpoint parameters). Rendered curves allow a comparison between the effect of AChEIs on patients with AD pathology versus AD + DLB. AD/AChEl(−): black; AD/AChEI(+): red; AD + DLB/AChEI(−): green; AD + DLB/AChEI(+): blue. D) Within groups, the effect of ApoE4 allele(s) and AchEI therapy are significant. Rendered curves depicting MMSE decline that combine Pure AD patients into four groups. ApoE4(−)/AChEI(−): black; ApoE4(−)/AChEI(+): red; ApoE4(+)/AChEI(−): green; ApoE4(+)/AChEI(+): blue.